


Integrating various software with CRM systems is an essential element for businesses looking to increase their operational efficiency. Such data integration offers organizations more expansive and mature capabilities and enables better communication between management and value-added functions like marketing campaigns, analytics, payment processing, and customer service tools — making them necessary tools eCommerce businesses are leveraging in an ever-evolving digital landscape.
An integrated CRM enables you to access sales data, financial data, and customer relationship data across platforms, streamline inventory management, and create more tailored strategies based on customer data collected through the CRM platform. Leveraging a CRM platform like Salesforce CRM and connecting via application programming interface (API) further enhances the ability to understand and guide the customer journey through every touchpoint, reduce manual data entry, improve visibility into the sales pipeline, and shorten the sales cycle.
In this article, we discuss the ten essential CRM integration methods—such as email campaigns, social media managers, and project management software—businesses and sales reps should consider taking the volume of their operations up a few notches while improving business growth and customer satisfaction over time through smarter use of CRM data.

Integrating email marketing software with a CRM platform is one of the most powerful CRM integration strategies that can help maximize customer interactions and increase lead generation.
Email messages delivered consistently to the right prospects, improve both conversion rates as well as customer engagements that result in sales.
There are warm leads who have interacted with the organization before; sending personalized marketing messages through integrations helps teamwork easier and quicker to reach potential buyers at the perfect time right in their mailboxes. An informative newsletter sent regularly reinforces customer relationships while providing updates when needed for keeping customers updated about the progress.
When email platforms connect directly to your CRM software, campaign engagement data automatically updates customer records. This eliminates manual data entry and ensures your sales team and marketing departments are working from the same customer data.
Email marketing tools provide businesses with the ability to manage communications and marketing campaigns with existing and potential customers across multiple email accounts efficiently. Popular examples of email marketing software programs include Mailchimp, Constant Contact, Sendinblue, Benchmark Email, Zoho Campaigns, SendGrid, and Emailybuddy. These solutions allow users to run custom campaigns through forms or automated workflows―making it easy for organizations of all sizes to utilize this powerful digital marketing channel from one central place.

Enhancing Customer Relationship Management (CRM) systems with social media management integrations helps businesses better track customer interactions on each platform. By connecting an integrated CRM to social tools such as Hootsuite, Sprout Social, and eClincher, companies can aggregate conversations from all their channels into one location for streamlining marketing and customer service activities, eliminating data silos and centralizing customer relationship data.
Such integrated data furnishes marketers with advanced analytics offering highly customized insights about pipeline opportunities in real time and helping prioritize or automate when needed. Every comment, message, or engagement becomes part of the customer record.
This visibility allows sales reps to better understand customer behavior while helping the sales team identify new sales pipeline opportunities.
Social media management tools are some of the most important CRM integrations, as it provides businesses a chance to monitor and improve their presence on multiple social networking platforms.
Popular choices include Hootsuite, Buffer, Sprout Social, and Sendible for managing accounts across Facebook, Twitter, Instagram, YouTube, and others.
As well as allowing users to comment and reply directly from CRM system notifications within these integrated tools; real-time collaboration is further enabled by enabling access roles based on user qualifications to allow multiple team members access on the fly without disrupting privacy or data integrity rules.

Streamlining customer support with CRM integrations is essential to ensuring a seamless customer experience with your CRM. With the right CRM integration between help desk platforms and CRM software, you can dramatically speed up your response times and allow team members to collaborate more efficiently to help customers reach resolutions faster, which plays an important part in customer satisfaction.
Examples of popular customer support & help desk solutions that integrate well with CRM systems are Freshdesk, Zendesk, and Helpshift which provide comprehensive ticketing functionalities primarily aimed at managing feedback from customers on digital channels like calls, emails, etc.
Additionally, these support tools feature automated questionnaires and specialized detailed user profiles that give agents further insights into client relationships when servicing tickets for help or assistance inquiries, offering personalized customer service and allowing business to manage customer relationships more effectively.
A call center CRM integration combined with a business phone system ensures every customer interaction is logged without manual data entry.
Common features offered by such integrations include ticketing, service automation, personalization services, KPIs tracking, omnichannel intelligence private channels or live discussion panels.
With an integrated CRM, support agents can access:
Popular customer support and help desk options include ServiceNow Customer Service Management (CSM), Zendesk Support Center Suite of Products and Freshdesk multi-channel CSE software platforms.
Implementing these services can drastically improve the quality of the user experience for both employees and customers alike.
Project management software offers businesses a wide array of tools, such as task delegation and resource management tools that help them increase operational efficiency. Integrating project management systems with your CRM platform improves coordination between departments and enhances collaboration tools usage across teams.
Using these specialized systems, organizations can track progress, CRM data, and customer records at every stage within a project in order to identify potential challenges along the way and resolve any sustainability issues quickly. This integration reduces data silos and prevents information gaps between departments.
An integrated CRM enables instantaneous collaboration among sales team members and helps to bridge shortcomings with existing models for data communication delivery.

Project Management Software involves connecting a CRM system with task management systems to help improve performance and optimize execution.
Choosing the right software for these purposes can help streamline complicated business processes, generate valuable reports, discover opportunities, and save money and time.
Popular project management tools for this include Asana, Trello, Basecamp and nTask are all user-friendly platforms that enable collaboration between stake holders for different roles related to marketing operations in businesses.
Integrating an e-commerce platform with your CRM can boost sales and improve customer experience. By connecting platforms to your CRM solution, customer data and financial data sync automatically.
Through this integration, sales reps can easily check out customers' order details and customer interactions stored in the CRM while they are shopping online and use essential CRM data collected to improve the customer service process.
This integration CRM smooths the purchasing flow between businesses and their customers dramatically.
Additionally, insights into customer purchasing behavior sent back from the same platform and marketing campaigns are directly transferred to insights for nurturing leads inside of a CRM.

Integrating a powerful e-commerce platform with your CRM system can help to enhance customer experience, boost sales and convert visitors into buyers. Popular options include Shopify, Magento, and WooCommerce.
Some platforms offer direct integration while for others you may need specialized services like extensions or APIs. All of the solutions boast industry-leading payment security features, responsive design capabilities that make the checkout process smooth on any device type, and 24/7 technical support should you need it.

By integrating marketing automation tools with the CRM software, it's possible to automate many of the redundant and manual tasks associated with customer outreach communications. By connecting automation platforms to CRM software, businesses can eliminate manual data entry by creating automated workflows that nurture leads, assigning tasks to sales reps, and triggering marketing campaigns based on customer interactions.
This frees up more time to provide a better level of service to current customers while allowing sales team employees to focus their efforts on analyzing trends or honing campaigns to target new prospective buyers for the sales pipeline.
Popular examples of automated marketing include sales and special promotions emails along with lead nurturing campaigns tailored towards prospects' own needs and interests.

Communication and collaboration tools involve utilizing integrated CRM solutions to enhance team collaboration in the workflow.
When these business apps connect through CRM integration, customer data updates instantly and conversations stay aligned with customer records. This type of integration can streamline communication between staff members by reducing data silos, as well as allow for better allocation of tasks and resources.
Popular CRM platform options include Slack, Google Hangouts Chat, Zoom, Microsoft Teams, and numerous others. By having integrated systems such as these into your CRM better performance can be obtained from team collaborations which creates increased efficiency no matter company size or industry.
Integrating accounting and invoicing software with CRM systems are becoming a necessary ingredient for many businesses striving to meet customer demands.
This CRM integration ensures financial data flows automatically into CRM data, including extending estimations of costs in contract features to support deal velocity whilst creating richer, more accurate financial insights.
Specific capabilities offered by this type of integration feature heavy balance sheet workflows, and automation attached form submission processes into deals tracking modes safely and preserve sensitive banking information securely.
By syncing CRM software with accounting systems or even enterprise resource planning platforms, businesses eliminate manual data entry and avoid discrepancies between financial data and customer records.
The result is a more accurate sales pipeline and better forecasting across the sales team.

Accounting and invoicing software can be integrated with CRM to streamline financial processes. Software like Quickbooks, FreshBooks, Wave, Zoho Books and Sage offer features such as order creation, billing automation, invoice organization and tracking revenue that make it easier for businesses.
Integration of these popular accounting solutions into a CRM system makes business more efficient by synchronizing data across platforms and avoiding duplication of customer information entry.
This simplifies bookkeeping automatically providing customers with an accessible yet secure database for digital payments as well as clearance functions.

CRM systems comprise customer survey and feedback tools, designed to gather valuable customer data insights that can inform decisions and measure customer satisfaction. These integration tools simplify the process of conducting polls, ratings, and surveys for speedy responses from customers.
Some popular options include Survey Monkey, QuickHelp Feedback Surveys, Client Checker Insta Survey etc.
Implementing customer survey integrations into business processes allows improving the past performance analysis to improve the future ones thus yielding better customer experiences and streamlined operations overall.
In conclusion, selecting the right CRM integration strategy for your CRM system is pivotal to enhancing business efficiency. Whether connecting CRM software to accounting systems, collaboration tools, a business phone system, or eCommerce platforms, an integrated CRM transforms how organizations manage customer data and customer interactions. The 10 integrations outlined above spell out an important suite of tools that provide everything from improved customer service and data insights to automated marketing processes and streamlined team collaboration.
Regardless of the shape or size of a company, selecting the functionality-rich integration tools best suited for operational needs will help take their services yet another level up.

Ever since ChatGPT launched, marketers have been increasingly relying on generative AI to scale their content creation.
For SEO in particular, AI-generated content seems like an excellent way to speed up the content marketing process and significantly cut costs. Unlike the black hat article spinners of the past, modern language models like ChatGPT (and similar tools like Jasper and Google Bard) produce intelligent, original content that reads as if it were human written content. To the untrained eye, it’s hard to tell the difference.
So, why would you want to identify AI generated content? If the output reads well, what’s the problem?
The issue boils down to quality. AI-generated content might read well, but it lacks depth and nuance. It can rank well in the search engines, but it’s not likely to provide adequate value for a visitor unless the topic is something extremely basic, like instructions for removing a carpet stain or directions to a business. Unfortunately, if you publish content made just for search engines, it will be considered spam by Google.
You may have heard that Google considers all automatically generated content to be spam. This was their position at one time.
In an Office Hours video from April 1, 2022, John Mueller clarified Google’s official position on automatically generated content, and stated, "If you're using machine learning tools to kind of generate your content it’s essentially the same as if you’re just shuffling words around… for us it's still automatically generated content and that means for us it's still against the webmaster guidelines, so we would consider that to be spam."
Google’s official stance has since changed. On February 8, 2023, Google announced that AI content is allowed unless it’s created to manipulate search rankings. Useful content created by automation is perfectly acceptable.
Despite the well-written nature of AI generated text, it can be detected easily using the right AI detection tools.
AI-content-generating algorithms are basically a glorified form of predictive text, where the system knows the words most likely to come after one another. To detect AI, this process is reverse-engineered, where the system predicts the most likely word to come before a certain word.
Most AI content detection systems rely on natural language processing techniques and statistical analysis. They compare patterns found in human generated text with those produced by large language models, looking for predictability, structure, and repetition.
Even though AI content is allowed, you might want to avoid publishing it to your website. Many businesses prefer publishing human written content only. If you hire writers to create content for you, and you’re not sure if they’re using an AI tool, here’s how to detect it.

One of the best AI content detectors is GPT-2 Output Detector. It’s a free AI detector and you don’t need to register for an account. This particular AI checker is highly accurate and allows you to paste in more copy than other tools.
This tool uses a scoring system of real/fake, so the higher your content scores as real, the more likely it was human generated. This tool doesn’t seem to have a character limit, but the more content you paste, the longer it takes to analyze.

Another great AI detector tool to use is GPT-Writer. Although some people have said it isn’t as accurate as other tools, it depends on the subject. For some content, this tool scores human-written text as 100% human-generated content, while other tools score the same content at 98% human-generated. GPT-Writer limits samples to 1500 characters, but that should be enough to get the information you need. If you aren’t sure, run multiple samples. Running multiple samples reduces the risk of false negatives.

AI-Detector – Content at Scale is another highly accurate content detector and has a 2500 character limit, which is more than enough to get a decent analysis. It’s especially useful when analyzing long-form AI content for consistency and structure.

There are a few tools that don’t make the cut for reliability, but you may find them useful. The first one is AI Detector Pro (the free version).
Your input is limited to 200 characters, which may not tell you much. However, the paid options might be more beneficial. Even so, with accurate free tools like GPT-2 Output Detector, there’s really no reason to pay for a tool unless you need the extras, like reporting.

Originality AI is a plagiarism and AI detector, so you get the best of both worlds with this tool. However, some people have said it was really easy to alter a little text to bypass the detections and get a human score.
Often, when people use AI tools to generate content, they keep the headings intact or alter them by a word or two. You can reverse engineer an article by plugging one heading at a time into some AI tools to see what content is generated. If the content was written using the same generative AI tool you’re using, each heading will likely generate text that can also be found in the body of the article you’re investigating.
For example, say the article you want to verify contains the heading, “Why is AI content bad?” If you type this heading into Google Bard, you’ll get several bullet points in response. If the content of those bullet points also appears in the article either word-for-word or very similarly, you can be fairly certain it was written using AI.
You can also plug in full paragraphs from the article in question. If the AI tool returns content that is also found in the article, it is more than likely AI-generated.
Automated detection tools are great for detecting AI-generated content, but you can also use manual methods. Here are some things to look for:
No AI content detection system is perfect. Even the best AI content detectors can produce false positives, incorrectly flagging human written content as AI.
Although you don’t need to worry about AI-generated content hurting your search rankings simply for being AI, there are several reasons to avoid it:
There are two main ways to avoid using AI content: to spin scraped content and to fill space on your website.
Scraped content is spam and spinning scraped content is plagiarism. Google has algorithms that can detect scraped content that has been altered by an AI tool. Publishing scraped content has always been considered spam, and using ChatGPT or any other tool to alter it is still considered plagiarism. In other words, don’t steal other people’s content and use AI to rearrange it to make it look original because Google will know.
Another use case to avoid is filling space. If you’re generating long articles to populate your blog or other website pages just to fill it out, you’re probably not providing value to visitors.
Back in December 2022, Google announced a Helpful Content system update that promised to detect and suppress content made for search engines and promote websites designed for humans.
Many people noticed a drastic drop in rankings after this update, even sites with high-quality human-created content. It’s too risky to use AI tools to populate your website for the sake of filling space. You’ll waste your time, money, and you probably won’t rank.
Poor-quality content that doesn’t provide value isn’t going to rank whether it was created by a human or ChatGPT. Google can tell the difference between AI-generated content created to manipulate search rankings and content that exists to provide value to web visitors. If you choose to use AI tools like Jasper, ChatGPT, or Google Bard, be responsible.
There’s nothing wrong with AI content as long as it is helpful and provides value to your visitors. As long as you follow Google’s E-E-A-T Guidelines (Experience, Expertise, Authoritativeness, and Trustworthiness), you can rank AI content in the search results just like any other page.
Remember AI is typically not as good at developing high-level digital marketing strategies.
That's where we come in! Contact us today!


So, you want to get your business’s name out there. More importantly, you want to get it in front of key decision-makers in your industry.
But what if your business is relatively small and you’re on a tight marketing budget? How do you make the right connections and get good brand mentions?
The answer is public relations (PR). Though PR may seem like something only for big brands, this isn’t true. Even small businesses can take advantage of PR strategies, and fortunately, they don’t require big marketing budgets.
In this article, we’ll go over what PR means and our top tips for improving your PR outreach at a minimal cost. Let’s get started!
PR refers to managing and maintaining a positive public image of your brand. Typically, this is done by seeking out positive exposure on media platforms that your target audience follows.
For example, PR could involve reaching out to a news outlet to do a story about your business, publishing a press release for a new product launch, pitching a story to an industry magazine, or featuring as a guest on an industry-relevant podcast. There are many ways to approach PR.
That said, PR is not to be confused with marketing. Both are concerned with building your business, but marketing is ultimately focused on boosting your bottom line by increasing revenue, whereas PR is primarily concerned with cultivating a good business reputation.
Public relations plays a critical role for small businesses that want visibility without draining their PR budget. Unlike paid advertising, public relations focuses on earned media coverage, which can help increase brand awareness and strengthen brand reputation over time. Even with a limited PR budget, small business PR efforts can generate meaningful results when backed by a clear public relations strategy.
For small businesses, affordable PR tactics like distributing press releases, using press release distribution, and leveraging digital PR tools can drive website traffic and build credibility with key stakeholders. When your PR efforts are aligned with your target audience, even modest PR campaigns can deliver measurable PR ROI.

Source: https://www.kochiesbusinessbuilders.com.au/wp-content/uploads/2022/02/public-relations.jpg
Now that you know what PR is, here are some tips to improve your PR outreach:
Before you start reaching out to media outlets, make sure your business has a good online presence. This means going over your business website, social media profiles, and other online accounts to make sure they look clean and professional. This is especially important for small businesses executing small business PR on a limited PR budget.
Get rid of any broken pages or links on your website and make sure you have a professional photo on your social media accounts and that you actively use them. There’s nothing that says your business is out of touch more than an outdated website or an unused social media account.
Another way to improve your online presence is to create a professional media kit. This is a small document that includes information about you and your company such as a bio and a professional photo. Include past media coverage, links to recent articles, company milestones, and notable company initiatives. By including your media kit every time you pitch a media outlet, you make it easy for media professionals, public relations professionals, and relevant journalists to cite and feature you.
If you’re planning a successful PR outreach campaign, having access to the right PR outreach tools can streamline the process and help you target the appropriate contacts. These tools make it easier to build strong media relations and establish credibility among PR professionals and the wider media industry. A polished website also supports your broader public relations strategy, strengthens brand reputation, and improves the performance of future PR campaigns.
Next, determine who you want your PR efforts to reach. In other words, who is your target audience and what media outlets do they follow most?
Defining your target audience is the foundation of a successful PR strategy. For example, if you own a fintech company, you may want to target business owners by pitching a news outlet like Forbes, Fast Company, for Business Insider. Or if you own a real estate business, you might aim for a feature in Inman or Housingwire.
Before launching PR campaigns, build a focused media list of journalists, bloggers, and relevant publications. The goal is to find out where your target market hangs out and get your company name talked about in those circles. If you’re not sure where your target market is, consider surveying your existing customers to find out.
Also, keep in mind that the definition of media is expanding. In addition to getting featured in traditional publications like the Wall Street Journal (WSJ) or the New York Times (NYT), you may want to target various social media platforms, blogs, and independent publications. Understanding the evolving media landscape ensures your public relations approach aligns with your target audience and maximizes your PR budget.
Whatever you do, make sure the outlets you reach out to serve your target market and cover what your business is about.
If some of the news outlets mentioned so far sound out of reach, that’s okay. You don’t have to start by pitching top newspapers. In fact, you probably shouldn’t. It takes time to cultivate good PR.
Instead, set realistic and manageable PR goals. Start by pitching smaller publications and then gradually work your way up to pitching bigger ones. You’re more likely to get in with bigger outlets if you already have some smaller media mentions.
A successful PR strategy requires clearly defined key performance indicators. These may include earned media coverage, growth in website traffic, backlinks, or brand mentions tracked in Google Analytics.
Using Google Analytics, you can measure referral traffic from press releases, evaluate campaign performance, and calculate PR ROI. Monitoring key performance indicators ensures your PR budget is allocated effectively.
Instead of launching multiple PR campaigns at once, focus your PR efforts on initiatives that align with your overall PR strategy. A good PR strategy prioritizes sustainable growth and long-term successful PR results.
Once you’ve established some realistic PR goals, you can work them into a long-term PR strategy.
Another way to get your company name out there is to share your expertise online. This could mean publishing valuable insights on your business’s blog or on social media. Contributing commentary on recent articles, publishing thought leadership, and engaging in social media commenting all support your public relations efforts.
For example, if you run a wealth management firm, you could post your top tips on how millennials can save for retirement. Or if you own a personal injury law firm, you might post about ways to win a car accident lawsuit. This is especially powerful for tech startups and knowledge-based small businesses.
The idea is to become a thought leader in your industry niche. That way, media outlets and public relations professionals will be more inclined to feature you (because you already have a following), and in some cases, they may even reach out to you, increasing your chances of earning additional media coverage and long-term successful PR increase.
When it comes to actually pitching media outlets, make sure you have a newsworthy story to tell with a unique angle. Media companies get pitched stories all the time, so yours needs to stand out to get their attention.
Focus on what makes your company unique but don’t forget to pitch a story that will be useful to the publication. Research their audience and what types of content they have published in the past. This will give you a clue as to what they’re looking for.
Company milestones, product launches, and broader company initiatives can become impactful press releases when framed strategically. A well-written press release improves your odds of securing meaningful media placements and increased media coverage.
Effective media outreach requires understanding your audience and the needs of the publication. This approach strengthens your overall public relations strategy and increases PR ROI.

If you’re having trouble finding media outlets to reach out to, there are many PR tools and resources out there that can help. Here are just a few:
On top of using social media to connect with journalists, you can use it to identify and build relationships with industry leaders. For example, you can use it to connect with influencers who may agree to advocate for your brand or sponsor one of your products. When executed properly, micro influencer partnerships enhance brand reputation and complement your broader public relations strategy.
Some PR campaigns include social media ads, while others rely on organic social media promotion and strategic social media commenting.
The beauty of using social media for PR is that it’s free. You don’t have to spend any money to get into the right circles. However, you will need to dedicate time and effort to being active on the platform. That’s true whether you’re using Twitter, Instagram, Facebook, or LinkedIn.
Whenever you do get media coverage, it’s important to share it. Highlight successful press releases, positive reviews, and notable media placements across your channels. For example, if you’re a guest on a podcast, share the link to the episode across social media. Or if your brand is featured in a news article, share it online and tag the outlet and journalist.
This not only helps spread your brand name online but helps strengthens your relationships with key stakeholders, media outlets, and journalists, who may then tap your shoulder for future features. Sharing coverage also boosts website traffic and improves long-term PR ROI.
If you haven’t been able to tell already, relationships are the foundation of successful PR. Consistent PR efforts aimed at supporting journalists and public relations professionals build trust over time. Without them, getting good press will be extremely difficult.
One way to improve your media relationships is to start building them early. Don’t wait until you get a feature in an article or podcast. Begin getting to know the right people now by offering your help and expertise. Take a value-first approach, where you give, give, give, and only ask once you have a reason to expect something in return. That way, you’re more likely to get the media features you’re after.
Participating in local event sponsorship opportunities is another effective small business PR tactic. Strategic local event sponsorship can generate additional media coverage, strengthen ties with your target audience, and improve overall brand reputation. This helps you get to know different people you may not otherwise meet and can lead to good PR opportunities.
Relationship-driven public relations helps maximize the impact of your PR budget and supports long-term successful PR outcomes.
Lastly, there’s no point in investing in a successful PR strategy if you don’t track your results. As the late Peter Drucker said, “You can’t improve what you don’t measure."
How do you measure PR results? Start by following the news and social media to see when your company name gets mentioned. Many platforms like Twitter allow you to track different keywords or hashtags, for example.
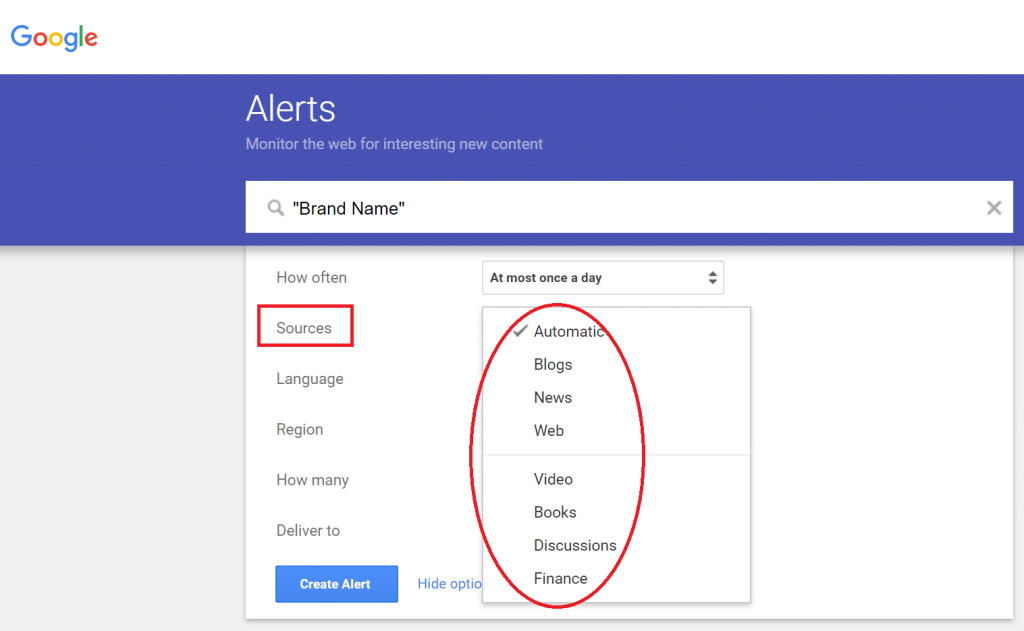
Another easy way to do this is to set up a Google Alert. This lets you collect online mentions of different keywords, such as your company name or industry, via daily or weekly emails.

Use Google Analytics to measure website traffic generated from press releases, media placements, and social media promotion. Reviewing Google Analytics reports allows you to evaluate key performance indicators such as engagement, conversions, and traffic sources.
Analyzing this data helps calculate PR ROI, optimize your PR campaigns, and allocate your PR budget more effectively. A data-driven PR strategy ensures your public relations efforts consistently deliver measurable growth.
The point is to track how often your brand is mentioned so you can see what is working in your PR strategy and what isn’t and then adapt.
If managing press releases, press release distribution, media outreach, and long-term PR campaigns sounds overwhelming, don’t worry. PR outreach can be challenging, especially when you’re just starting out. What you don’t want to do is blast as many PR pitches to as many outlets as you can think of. There are better ways.
To take your brand recognition to the next level, consider partnering with Digital.Marketing. We have established relationships with some of the internet’s top publications, and we can help get your company’s name featured in them in no time. Contact us today to learn more! We look forward to learning more about you and all your PR needs.

No matter how careful you are, there’s always the chance that you’ll run into a major social media catastrophe. Maybe you posted something in jest that offended the wrong crowd. Or, maybe you accidentally sent a reply that was meant to be a direct message. Maybe something happened with your product or software, and your social feeds are blowing up with angry responses from other online users. In any case, your social reputation is in serious jeopardy and you have a limited amount of time to try and mitigate those losses.
If you find yourself in the midst of a social media crisis, don’t panic. Instead, focus on completing these five steps:
Your first course of action should be to stop the bleeding—that is to stay, and prevent any further damage from being done. There’s nothing you can do to reverse what’s already happened, but you can take action to prevent anything else from stacking on top of it. For example, if you’ve posted something borderline offensive that seems to be riling people up, take the post down. If there’s an issue with your software causing people to angrily post on your timeline, connect with your developers and try to start fixing the issue.
The goal here isn’t to pretend like the incident didn’t happen (see the next step), but rather to prevent any further spread that you have the power to prevent. Most of the time, this simply means taking down the material in question, but there’s a limit to how much you can do.
One of the worst things you can do is try to cover the incident up. The social meda world is public, observant, and fast, and if you try to stop information from spreading, that’s only going to make people want to spread it more. For example, if you posted something that wasn’t meant for the public eye and you try to delete posts that recognize this mistake, you’ll only encourage those users to post more aggressively.
Instead, address the situation directly. If you’ve made a mistake or have in some way damaged your reputation in the eyes of your users, you can start out with a sincere apology. If there’s a situation still underway, such as a software outage, you can post all the details you currently have on the subject and assure your followers that you’re working hard to correct it. The more open and transparent you are, the less backlash you’re liable to face (and the less interest people will have in rubbing your nose in it).
In today's digital age, having a solid Social Media Crisis Management plan is crucial. By implementing a well-thought-out crisis response and communication strategy, you can effectively manage public sentiment and mitigate the impact of a social crisis on your brand. Learning from the incident can also help shape future campaigns to prevent similar issues from arising.
Every follower’s voice matters. Every response counts. It’s your job to get on social media channels and respond to as many individuals as possible. If you’re a major national brand and this incident has gone viral, there’s little hope for you to respond to every single individual. If that’s the case, just do your best. A little individual acknowledgment is usually enough to make even the most vocal dissenters quiet down (at least for the moment).In your responses, be sincere, and show that you’re actually listening. Don’t post a canned response over and over again or you’ll look like a robot and open yourself to more criticism. Instead, acknowledge your followers’ complaints and concerns specifically and offer your sincere thoughts on the matter (apologizing again, if necessary).
An effective social media crisis management approach includes personal, heartfelt responses to build back trust. By integrating this into your overall crisis management strategy, you can mitigate damage and start the process of rebuilding your brand's reputation.
Once the first wave of responders has been addressed and a calm begins to set in, you can take the next step—offering penance. Most crises arise from some kind of mistake or mishap by a brand that negatively affects its followers in some way. If this is the case, it’s your job to try and make it up to them.
How you make it up to them is completely up to you. A little bribery is usually welcome here, such as offering free products or discounts to anyone who was personally affected by the incident. You could also simply explain the situation and acknowledge what you’re going to do to make sure it never happens again. It’s also a good idea to give people a piece of contact information they can use to contact your company directly if they have further concerns—it shows you want to go out of your way to make things right.
A well-crafted crisis communication plan is essential to navigate a brand crisis effectively. Utilizing your crisis management strategy across all social media platforms ensures a cohesive and timely crisis response. Consistent and transparent crisis communications can help restore trust and maintain your brand's reputation.
This may be the most important step since it’s going to help you prevent problems like this from arising in the future. Do a thorough review of all the steps that eventually led to this catastrophe, including who’s in charge of posting on social media, what steps were or were not followed, and any influencing factors that could have been addressed before the problem began to escalate. Determine if there’s any corrective action you can take to prevent a similar incident arising and if there is, take it.
Additionally, consistently monitor social media to quickly identify potential PR crises before they escalate. By understanding your target audiences and maintaining a consistent brand voice, you can respond effectively and implement proactive measures to mitigate future risks.
Not every social media crisis looks the same. Some originate from customer complaints, others from internal missteps, product failures, or public controversies. Understanding the category of crisis helps organizations determine the appropriate response strategy and the urgency required to contain the issue.
Below are several of the most common types of social media crises businesses encounter.
Customer service issues are one of the most common triggers for social media backlash. A frustrated customer may post a complaint, screenshot an email exchange, or upload a video documenting a poor experience. If the issue resonates with other customers, the complaint can quickly gain traction through shares and comments.
What begins as a single post can escalate rapidly when others contribute similar stories or when the brand fails to respond promptly. Companies that ignore or dismiss early complaints often see these situations grow into larger reputation problems.
Typical examples include:
Organizations that monitor social channels closely and respond quickly often prevent these situations from escalating.
Another frequent source of social media crises involves employee behavior. In some cases, employees post controversial or offensive content from their personal accounts, while in other cases internal communications are leaked publicly.
Even when a post originates from an individual employee, audiences often associate that behavior with the company itself. As a result, organizations must respond quickly to demonstrate accountability and clarify whether the behavior reflects company values.
Examples include:
Companies that maintain clear social media policies and training programs are generally better equipped to respond when these incidents occur.
Product defects or service outages can also trigger major social media crises. When a product fails or a service becomes unavailable, customers often turn to social platforms first to voice complaints or seek answers.
These situations tend to spread quickly because they affect many customers simultaneously. If the issue remains unresolved or communication from the company is unclear, frustration grows and online discussions intensify.
Common examples include:
In these cases, transparent communication is critical. Customers typically respond more positively when companies acknowledge the issue quickly and provide clear updates.
Public statements or actions by executives can create significant backlash on social media. When leaders make controversial remarks or become involved in political or ethical disputes, the reaction often spreads beyond the organization’s existing audience.
Because executives are closely tied to brand identity, these crises can damage trust and trigger calls for boycotts or leadership changes.
Situations that commonly trigger this type of crisis include:
In these scenarios, organizations often need coordinated messaging from leadership, public relations teams, and legal advisors.
Even well-intentioned marketing campaigns can trigger negative reactions if audiences perceive them as tone-deaf, misleading, or offensive. Social media allows consumers to react instantly to advertising messages, and criticism can spread rapidly when a campaign misses the mark.
Campaign backlash often intensifies when users begin sharing parody versions of ads, criticizing the messaging, or calling for the campaign to be removed.
Examples include:
Brands that quickly acknowledge missteps and adjust campaigns are more likely to contain the damage.
Not all social media crises originate from legitimate issues. In some cases, false rumors, manipulated content, or misinformation about a company spreads online. Even when claims are inaccurate, the speed of social media can allow them to gain traction before the truth is clarified.
These situations require a careful balance between correcting misinformation and avoiding further amplification of the false narrative.
Typical scenarios include:
Clear, factual responses and transparent communication are essential when addressing misinformation.
Understanding the nature of a social media crisis helps organizations determine how quickly they need to respond and which teams should be involved. A customer service complaint may require a direct support response, while a leadership controversy may require coordinated communication from executives and legal advisors.
Organizations that categorize crises effectively are better positioned to respond quickly, control the narrative, and protect their reputation.
These five steps should be enough to get you out of even the most threatening social media crises. There’s no way to prevent all the damage, especially for larger blowups, but you can at least decrease it to a minimum and set yourself up for a speedy, graceful recovery. Even the best-prepared, most careful brands can encounter unfortunate situations. All you can do is manage their effects and prevent them from happening as much as possible in the future.
If you have a quality CRM software system, you can use your CRM for crisis management.
Need help managing your digital marketing? We can help!

You’ll also explore startup costs, realistic financial projections, and how to assess whether you’re personally ready for the pressure ahead. Building a financial foundation early, including understanding cash flow, defining your value proposition clearly, and managing finances responsibly, is not optional. It’s a crucial element of long-term survival.
Understanding your target market through thorough market research is crucial for your startup's success. Additionally, developing a solid business model and continuously gathering customer feedback can significantly increase the chances of your startup becoming one of the successful startups.
This chapter also explains how to test a minimum viable product before investing heavily. Instead of building a perfect product in isolation, you’ll validate demand, gather early feedback, and reduce risk. It’s often just the beginning of refining your offer, but it’s one of the smartest first steps you can take.
Incorporating user feedback is essential for refining your startup business and ensuring it meets the needs of potential customers. It’s not about defending your idea. It’s about improving it until you achieve product market fit and create a sustainable business model. Additionally, implementing search engine optimization strategies can boost your startup's visibility and contribute to long term success.
You’ll also learn foundational skills, from communication to managing finances, that strengthen your financial foundation and support steady growth. Small businesses often overlook these basics in the rush to scale, but discipline in the early stages creates a competitive advantage later.
You’ll learn the key qualities of a compelling elevator pitch and how to articulate your value proposition clearly in under two minutes.
Raising money isn’t just about numbers. It’s about trust. Investors want to see traction, realistic financial projections, and a clear go to market strategy. They want confidence that you understand your market segment and have a path to sustainable business revenue.
You’ll also discover how to handle rejection. Hearing “no” is part of raising money. Sometimes it means refine your pitch. Sometimes it means adjust your growth strategy. Occasionally, it means you need a stronger financial foundation before approaching investors again.
Mentorship is another powerful asset. A seasoned mentor can offer a direct line to hard-earned wisdom, industry connections, and honest feedback when you need it most.
Your startup team shapes your culture, your speed, and your ability to execute. Choosing the right co-founder is one of the most important decisions you’ll ever make. A great co-founder balances your strengths, challenges your blind spots, and shares your long-term vision. A misaligned co founder, on the other hand, can derail momentum fast.
This chapter covers how to identify the types of employees you need, how to build a strong company's culture from day one, and how to retain top talent. The company's culture you create will influence decision-making, productivity, and morale. It’s not about ping-pong tables. It’s about trust, accountability, and shared purpose.
You’ll also learn how to structure your startup team so your sales team, marketing leads, and product developers work in sync. When everyone understands the value proposition and target customers, your messaging becomes sharper and your competitive advantage becomes clearer.
Understanding your target audience is crucial for a business owner when crafting a business plan and growth strategy that ensures startup success. Additionally, maintaining the financial health of your business is essential for sustaining growth and stability in the long run. Monitoring cash flow, reviewing financial projections, and adjusting spending based on real data are part of managing finances responsibly.
For early stage companies, it's crucial to differentiate your go-to-market strategy from existing solutions in the market. A successful entrepreneur understands the importance of aligning marketing efforts with the pain points of target customers to attract venture capital and ensure the business's growth.
You’ll also learn how to identify new opportunities within your market segment, expand your growth strategy, and build systems that support a sustainable business rather than short-term spikes.
Marketing is how you communicate your value proposition to the world. This chapter walks you through general marketing best practices, how to increase online conversion rates, and how to build a content strategy that earns trust.
Search engine optimization and email marketing become powerful tools when used consistently. Email marketing, in particular, gives you a direct line to your audience. Unlike social platforms, where algorithms shift constantly, your email list is an asset you control.
You’ll also explore how to engage in online communities, build authority, and support your sales team with messaging that addresses real customer pain points.
A thoughtful go to market strategy ties all these pieces together. From launch campaigns to ongoing customer engagement, your marketing must align with your broader growth strategy.
Startups fail for many reasons: poor product market fit, weak cash flow management, unclear value proposition, or breakdowns within the startup team. Understanding why startups fail helps you avoid repeating the same mistakes.
This chapter addresses common failures and how to recover from them. Growth requires experimentation. Experimentation sometimes leads to setbacks. The key is maintaining perspective and adjusting your growth strategy without losing momentum.
There are sacrifices. Long hours. Tough financial decisions. Moments of doubt about your co-founder, your direction, or your ability to keep raising money when resources are tight.
This chapter covers the hard truths: strained relationships, pressure to protect your financial foundation, and the emotional toll of leading small businesses through uncertainty.
But it also reinforces why many founders keep going. The freedom to build something meaningful. The ability to shape your company's culture. The chance to create a sustainable business that supports others.
This final chapter shares stories from experienced founders who have built small businesses, scaled startups, and navigated multiple ventures. They discuss preventing burnout, maintaining balance, and protecting personal well-being while managing finances and growth.
Happiness isn’t an afterthought. It’s part of building a sustainable business. When you care for your mental health, nurture your co founder relationships, and build a supportive company's culture, you increase your odds of long-term success.

Good marketing campaigns are built on a foundation of research. The more you understand about your business, your industry, your target demographics, and the resources available to you, the more effective your marketing messages become. Unfortunately, “research” is an ambiguous, general term. Telling someone to “research” to make their marketing strategy better will rarely point them in any meaningful direction unless they already have an idea of what they need to do to be effective.
The truth is, there are many different kinds of research that help you gather insights, most of which are helpful, and some of which demand more investment and intensity than others. Some approaches rely on numerical data and statistical data, while others focus on opinions, behaviors, and deeper customer motivations. Together, these methods form a practical market research process that helps businesses reduce guesswork and make smarter decisions.
If you’re trying to make your marketing campaign as successful as possible, you’ll need to apply these five types of research, at a minimum:
I’ll start with one of the more obvious routes of research—your demographics. Market research is a well-known type of research, and is practiced, at least to some degree, by most businesses. That means learning about your target market, their needs, their motivations, and how their behavior changes over time. Your original business idea and business model should be based on market research methods, but you’ll need to continue pressing for more information as your business develops to refine your expectations and respond to any trends and interest changes as they arise. Without solid market research, even the most creative campaign can miss the mark.
There are a few types of market research you can rely on. One of the easiest is partnering with a market research firm, or relying on preexisting outside data (like census information) to inform your conclusions. You could also conduct primary research here, using survey research, interviews, online questionnaires, and other qualitative research assessments to learn more about your target audience. This kind of data collection allows you to learn how people feel about your brand and what influences their buying decisions.
Some businesses use secondary research by analyzing existing reports, census data, industry publications, and previously published market research study findings. This secondary research is often a fast and affordable way to identify market trends and industry patterns.
Both approaches matter. Secondary research provides a broad industry perspective, while primary research allows businesses to gather insights directly from their audience.
Many market researchers combine qualitative research with quantitative market research. Qualitative research explores opinions, motivations, and behaviors. Quantitative market research focuses on measurable results such as numerical data and statistical data gathered through surveys or analytics tools.
The main goal is to simply learn more about who’s buying your products and services—who they are, what’s important to them, and what they mean to your business. Together, these insights make market research far more actionable.
Competitive research is all about knowing who you’re up against. No matter how original your idea is, you won’t be the only offer in town—at least not for long. Competitive analysis type of research allows you to see what strategies your competitors are using, and how effective those strategies are at attracting your shared target market. For example, are they producing more or less content than you are? How is it different?
This type of market research often includes exploratory research, where marketers analyze patterns, test assumptions, and investigate emerging market trends.
There are two big things to watch for during competitor research: what are they offering that you aren’t, and what aren’t they offering that you can? The former will allow you to close a potential gap between the two of you, outperforming them in a new area with a new direction. The latter is a critical opportunity for your business to break away. Identifying these opportunities through exploratory research can help your business stand out in a crowded market.
As the name suggests, channel-specific research is intended to help you better understand specific marketing channels that you could use in a campaign (or new tactics that improve your results and/or efficiency). Here, you’ll mostly rely on preexisting secondary research conducted by other parties, unless you’re willing to pay for an experimental venture into a new kind of marketing.
These reports often include data collected from past campaigns, revealing which channels drive engagement, conversions, or brand awareness. Marketers also use exploratory research to test smaller campaigns before investing heavily in a specific channel. This allows businesses to experiment with different tactics while minimizing risk.
Online research is your friend here; rely on marketing agencies and independent case studies of marketing success to inform your decisions. Look for any new outlets that you might not have considered, as well as older outlets that you could be using more effectively. Remain open to any new strategies, and always be willing to conduct more types of market research—in this digital age, new outlets emerge all the time. Staying aware of shifting market trends ensures your strategy remains effective as consumer habits evolve.
Original research is one of the most powerful forms of primary research available to marketers. Original research takes a lot of different forms, depending on your industry and the needs of your target audience. Its primary goal is to give your audience valuable information as an objective offer in exchange for something else. For example, you could use your original research to write and post an article designed to attract new people to your site or develop your original research into an eBook that you give away in exchange for a few bits of personal information of individuals.
The key to original quantitative research is that it must be original, so you can’t rely on secondary market research for this one. You can conduct online surveys, collect quantitative data based on objective facts or an idustry-focused market research study, or even rely on your own observations and structured data collection. The more valuable your information is to your users, the better.
Also, original quantitative market research can be enhanced by conducting focus groups to gather in-depth insights about customer satisfaction and brand loyalty. Unlike secondary research, this approach allows for precise data collection tailored to your brand research and marketing research needs, ultimately helping you better understand your target customers through numerical data.
To add depth, companies frequently combine these results with qualitative research methods. For example, focus groups allow marketers to hear detailed customer feedback in real time. A smaller focus group session can reveal opinions, frustrations, and motivations that surveys alone might miss.
Because the findings come directly from your audience, primary market research often produces insights that competitors cannot easily replicate.
Well-executed primary research also strengthens content marketing efforts. Brands frequently turn original data into blog posts, reports, and downloadable resources that attract new audiences.
Finally, you’ll have to research how you’re performing in comparison to your competitors and in a way that highlights potential areas for improvement. Performance research is a form of marketing research that evaluates how your own campaigns perform. In a sense, you’ll be researching yourself, which sounds easy—but drawing new conclusions when you’re so close to your business can be difficult.
This type of market research relies on a series of tools and/or agencies to help you understand key points of information on your performance, such as inbound traffic, user engagement, or online conversions. With each improvement or change, you’ll monitor these metrics closely, and ideally, they’ll grow over time. Performance research is hard to penetrate at first, as you’ll be drawing somewhat subjective conclusions about objective data, but you’ll get better at it the more you do it.
The great thing about these types of market research is their sheer utility—they can be applied to almost any marketing campaign you can imagine. Online, traditional, and alternative marketing directives all benefit from this additional information, leading to better messaging, and of course, better results. Like with any new skill, you may struggle when you first attempt more in-depth research, but the more you practice it, and the more you learn best practices for success, the more efficient you’ll become, and the more meaningful data you’ll be able to extract. It all starts with a commitment to learning more about your business environment.
Great marketing doesn’t happen by accident. It grows from curiosity, observation, and a willingness to keep learning.
By combining multiple types of market research including primary research, primary market research, secondary research, and exploratory research, businesses can build smarter campaigns and adapt as customer behavior changes.
Whether you're launching a new market strategy, testing a new business idea, or refining an existing campaign, consistent market research helps ensure your decisions are based on real insights rather than assumptions.
The brands that succeed long term are the ones that keep asking questions, analyzing the data collected, and using marketing research to better understand the people they serve.


Offering search engine optimization (SEO) services to your clients could be lucrative.
You help them rank higher in search engines, so they attract tons of organic traffic.
They pay you a few thousand dollars per month.
Sounds like a win-win, no? Well, as many ambitious content marketing agency owners can attest, executing the necessary work to make an SEO campaign successful can be challenging.
You need the right resources. You need the right tools. You need knowledge and experience. You need dozens of different specialists in fields like link building, mobile optimization, keyword research, and even data or Google analytics.
If you offer all these things yourself, you'll need to hire a full team, which can greatly increase your costs and jeopardize your profitability.
But there's another option – using a white-label SEO service (similar to what we offer at SEO.co).
What exactly is white label SEO? How does white label SEO strategy differ from white label marketing? And is it really as good as it seems?
A white label product is one that is figuratively "white labeled," meaning it's not branded by the company that produces it. Instead, it's branded and marketed by a second company, which typically masquerades as the product's originator.
In the specific case of white label SEO, this means another agency is going to do all the search optimization work on behalf of your clients. Depending on the arrangement, that could include keyword research, strategic consulting, content generation, link building, and even reporting and analytics.
Your client will never meet with the white label SEO reseller, nor will they see their brand or know they exist. Instead, they'll see all the work branded with your identity. You get to claim this work as your own.
White label SEO reseller services will charge you a fee (usually a retainer or a per-project fee) for their work. You can mark this up and charge your client whatever you think is appropriate. In exchange for simply passing information back and forth and monitoring the campaign to make sure it's being executed properly, you can make a handsome profit.
These are some of the best advantages of using white label SEO services:
Regardless of how much experience you personally have in search optimization, working with a white label agency gives you access to true experts. You don't need to have an encyclopedic knowledge of Google algorithm updates, nor do you need to offer sage-like wisdom about which keywords to target; instead, you can lean on people who have decades of combined experience and rest assured that your campaigns are going to be managed well. Additionally, because you'll be working with some of the best people in the industry, your clients will likely see better results than they would otherwise.
Whether you're interested in diversifying your overall digital marketing offerings or focusing exclusively on SEO services, you'll be pleased to know that working with a white label provider typically gives you significant flexibility. You can hire this agency for a couple of pieces of content, years' worth of ongoing efforts, or anything in between. If you lose a client, you can terminate your arrangement with the white label services agency. If you gain a client, you can expand your arrangement.
One of the downsides of building your in-house team is that you're fundamentally limiting the resources you can expend on SEO campaign services for your clients. If you only have a few people on your team, you'll have an upper limit of clients you can take on; once you reach that threshold, you'll be forced to either hire more people or stop growing. But with a white label agency, this isn't the case, as white label SEO providers are designed to be scalable. These institutions have access to tons of experts and resources, so they can easily grow with you. There's practically no limit to the work you can send their way.
Speaking of hiring, if you're working exclusively with a white label SEO agency, you won't have to worry about hiring at all. You don't have to worry about creating job descriptions, interviewing new candidates, or training people for a role that they're going to leave in just a few years. All that work is done for you, so you can just sit back and let those experts do what they do best.
Partnering with a white label SEO reseller could mean increased revenue opportunities for your company. If you're currently offering a suite of digital marketing services, but SEO is a weak point, you can now upsell all your existing clients on SEO tools and services – and appeal to new clients as well. And as previously stated, there's no upper limit to how much you can use your white label agency, so as long as you keep finding new SEO clients, you can keep growing.
Do you know the best tools to do research on your competitors? If you had to calculate your domain authority right now, would you be able to do it? Could you figure out where you're ranking for a variety of target keywords and use that information to devise SEO strategies for your campaign? Your white label agency can answer these questions confidently because they have the specialized tools and resources necessary to make their campaigns successful. These are highly specialized, highly experienced groups of people, so they have access to some of the best technologies and resources in the industry.
Salespeople spend a meager 30 percent of their time on selling SEO services. They spend the rest of their time answering emails, attending meetings, and tackling other administrative jobs that aren't relevant to their main responsibilities. If you take on new SEO clients, doing the work yourself, you and your employees are going to be forced to dedicate time to those SEO campaigns. But if you have a white label agency take care of everything on your behalf, suddenly, all that time becomes freed up. You can spend that time on much more important responsibilities, like investing in the business, making critical decisions, tackling core responsibilities, or even just taking a break if your schedule is already overloaded.
Some companies appreciate white label SEO packages because it makes them look amazing. When you report to your clients that you've helped them achieve rank one for some of their most lucrative target keywords, and when you let them know that you've doubled their domain authority in a relatively short amount of time, they're going to be ecstatic. They're going to see your own brand as a bigger, more impressive authority in the digital marketing space, and as a result, they're probably going to spend more with you. Whether you're interested in scaling up your SEO efforts, upselling your clients on different marketing services, or generating more referrals from your existing clientele, this is a net benefit.
If you were going to do all the SEO work yourself, would you be able to prove the value that your organization is adding? One of the perks of working with a white label SEO firm is that they take care of the reporting, analytics, and strategic decisions for you.

They'll give you a breakdown of all the work they did and the results they were able to achieve; they'll also make suggestions for how you can improve these campaigns in the future. It's up to you how you want to use this information.
So far, white label SEO solutions sound like a great deal.
But there are some disadvantages you'll need to consider.
The results of your campaigns are going to be heavily dependent on the quality of the white label agency you hire. While you may be able to do some of the SEO work yourself, the whole point of hiring a white label agency is to support a hands-off approach. If your agency isn't competent, if they don't have available resources, or if they simply misunderstand the goals of the campaign, it can work against you. However, this isn't necessarily an indictment of white label SEO in general; instead, it's a warning that you need to do your diligence before bringing on a white label SEO partner.
Some digital marketing leaders hate the idea of using white label services because they have less direct control. You'll be communicating with your clients constantly throughout this process, so if they ask you a tough question or if they criticize some of the techniques used in their campaign, you might not be able to answer directly. Additionally, depending on the partner you choose, you may not have much control or say in how the agency runs a particular campaign (e.g., link building or local SEO). If you want to see a different style of content marketing or if you have a different strategic philosophy altogether, you may need to find a different white label SEO partner or cope with the fact that this isn't your preference.
Most excellent white label SEO companies make transparency a priority. They openly communicate about their SEO philosophies, tactics, and approaches. They also openly report on their results, acknowledge their failures, and boast about their biggest successes. Even so, by its very nature, this relationship is never fully transparent. You probably won't be seeing or communicating with all the people behind your campaign, and you won't be able to granularly analyze every minor change to your client's web presence.
Working with a white label partner can also introduce some communication issues, especially if you don't have a clear line of contact with an account manager at that agency. If you accidentally misrepresent your client's goals or if your white-label agency misinterprets something you said, it could lead to problematic developments. Still, if both parties are committed to effective communication and some redundant measures to prevent these types of disasters, it shouldn't be a major concern.
You can technically charge whatever you'd like for the SEO services you offer your clients, but if you charge too much, your clients aren't going to pay it. Accordingly, most digital marketing agencies only charge a small markup on top of the core price of white label SEO services. If you compare this to what you could make if you offered all your services in-house, you might be disappointed.

There's no question that reselling SEO services, rather than doing the work internally, is going to lead to reduced profitability on a per-client basis – at least, if you're accounting for a perfect in-house scenario. The math works out very differently if you're forced to hire tons of new people, if you struggle with scaling, or if you aren't able to give your clients results that motivate them to stay with you.
Is a white label SEO provider the right move for your digital marketing agency?
That all depends. If you don't have the SEO experts to do the work in-house, if you're trying to maximize profitability while minimizing effort, or if you just want your clients to have access to the best experts in the industry, white label SEO is a no-brainer.
If you're concerned about transparency or if you want to maintain direct control over your clients' campaigns, white label SEO may not be a good fit.
For everyone else, you're probably somewhere in the middle. If you're feeling uncertain, or if you just want to be sure your white label partner is going to operate effectively, your best bet is to talk directly to a white label SEO company so you can get a better feel for what they do.
Ready to get started with a white label SEO plan? Or do you have a few questions before you're ready to jump in?

How Marketers Keep Pouring Money Into a System Where the House Always Wins
Let’s get one thing out of the way: paid ads work.
Sort of.
Until they don’t.
What started as a straightforward way to buy attention has slowly evolved into something that looks suspiciously like a Ponzi scheme.
Not in the criminal sense — not literal financial fraud — but in the systemic sense: unsustainable returns, over-reliance on new capital (i.e. ad budgets), and a growing pile of players who profit off the addiction rather than the outcomes.
A traditional Ponzi scheme is a form of investment fraud where initial investors are promised high returns with little or no risk.
Instead of generating legitimate earnings, the operator uses money obtained from new investors to pay earlier investors and previous investors. In many Ponzi schemes, payouts come directly from investors money, recycled until the scheme collapses and leaves investors losing tens of thousands.
Paid advertising isn’t illegal investment fraud, but the mechanics start to rhyme.
We need to talk about the Paid Ads Ponzi Scheme — how we got here, who’s getting rich, and how you can get out before your business becomes the next bag-holder.
The mechanics are simple:
Let’s not pretend everyone loses. Plenty of people are doing just fine:
Perhaps the most diabolical part of the Ponzi scheme is attribution.
Marketers cling to dashboards showing beautiful ROAS numbers. But attribution is increasingly broken:
It’s marketing participation trophies. Like a fraudulent investment account statement showing gains that aren’t real.
The Paid Ads Ponzi works until it doesn’t. The breakdown usually happens here:
Why do brands stay on this treadmill? A few reasons:
In Ponzi schemes, people stay because they fear missing out — or because they believe the returns carry little or no risk.
The difference between a pyramid scheme and a Ponzi scheme is structure.
But both depend on recruiting new investors to keep payouts flowing.
Some modern Ponzi schemes involve fake hedge funds, offshore entities, even Ponzi schemes involving cryptocurrencies, often linked to money laundering and hidden transfer money pathways.
Paid ads aren’t criminal fraud — but the dependency loop feels eerily familiar.
Paid media isn’t inherently evil. But it cannot be your only channel. If you're ready to escape, here's your game plan:
Let’s be clear: paid media has its place. It’s a powerful accelerant. But accelerants aren’t foundations.
You should treat paid ads like a faucet — something you can turn on and off, not something that controls your entire water supply.
If your business dies when the ads turn off, you don’t have a business — you have a leveraged position.
Even Charles Ponzi would recognize the dependency loop.
The ad platforms will keep tweaking algorithms. Agencies will keep proposing "new creative tests." Your CAC will keep rising. And unless you build something outside of the ad platforms’ walled gardens, you’re just the next mark in the Paid Ads Ponzi Scheme — paying previous investors, enriching the house, and hoping the scheme collapses after you’ve cashed out.
Build real marketing assets.
Diversify your acquisition portfolio.
And above all: stop thinking of paid media as growth — it's rented revenue.

.svg)


.png)


