Global ecommerce and retail marketing is entering a performance-and-first-party era: online sales continue to set records even as overall ad-budget growth cools, forcing teams to squeeze more yield from every channel (Adobe, eMarketer). Discovery is shifting toward social platforms and retailer ecosystems, accelerating the rise of retail media networks with high-signal, closed-loop measurement and growing budget share (eMarketer).
At the same time, rising CPC/CPM and tightening privacy guardrails require consented data, durable measurement, and lifecycle programs that compound—email/SMS, loyalty, subscriptions—augmented by AI to speed creative testing, merchandising, and product discovery (WordStream, Privacy Sandbox, Litmus).
This report distills the latest benchmarks and channel dynamics—what’s working in search, retail media, social/video, and onsite conversion—and how leaders are containing CAC, raising LTV, and turning seasonal spikes into sustained growth over the next 12–24 months.
Global retail media ad investment (USD billions): $128.2B (2023) → $153.3B (2024) → $176.2B (2025). Source: WARC/Global Ad Trends. WARC+2WARC+2

Digital advertising ≈ 75% of total global ad spend in 2025; traditional ≈ 25%. Within digital, retail media’s share is rising fast (mid-teens of total ad spend globally). Sources: eMarketer (digital share) and WARC (retail media). EMARKETER WARC

Notes & how to read this section
Below are three high-signal ecommerce/retail buyer archetypes you can target and measure against, with attributes grounded in current behavior shifts.

Source notes:
This illustrates how paid media budgets skew across platforms in a large ecommerce cohort: Meta ~70.7%, Google ~23.1%, TikTok ~2.9%, Other ~3.3% (Pinterest, Snapchat, Reddit, etc.). Triple Whale

Method notes:
Where the momentum is: HubSpot continues to grow its installed base per 2025 earnings updates, while Salesforce remains the incumbent for large, global retailers that need deep customization. (Directional growth per HubSpot’s Q2-2025 results; Salesforce widely entrenched with very high review volume.) Skai G2
What’s changing: Marketing automation is the most-replaced martech category for the fifth year running, with integrations and features the top drivers for switching; cost is the top consideration for new purchases. Expect continued migrations from generic ESPs to commerce-centric platforms (Klaviyo, Braze, Iterable). MarTech+1 Chief Marketing Technologist
Stack direction: GA4 + BigQuery (warehouse) + reverse-ETL into the ad stack is becoming the default measurement spine; teams layer Mixpanel/Amplitude for journey insights where app usage or granular events matter. G2
Where share is moving: Shopify continues to expand share across e-commerce technologies; Adobe/Woo/BigCommerce hold in niches (custom, B2B, content-heavy) but face app-ecosystem pressure. BuiltWith
What’s trending: Budget flow into retail media keeps climbing, with teams consolidating onto cross-retailer platforms (Pacvue, Skai) for unified pacing/optimization and more consistent measurement. Pacvue Skai

Ratings & counts (sources):
Shopify 4.4/5, 4,706 reviews; integrations list includes Klaviyo, GA/BigQuery, Meta/TikTok, HubSpot, Salesforce. G2
Klaviyo 4.6/5. G2
Mailchimp 4.3/5. G2
Salesforce Sales Cloud 4.4/5. G2
HubSpot Sales Hub 4.4/5. G2
Google Analytics 4.5/5; native BigQuery export noted in integrations. G2
Sources (dated within last 12 months):
Torrid full-funnel TikTok case study and results (+31.8% apps, +7% purchases, +27% recall; 15/85 spend split; Unified Lift) published by TikTok for Business in 2024; Ovative case study (Mar 19, 2025) reinforcing incrementality (24× vs last-click). TikTok For Business Ovative Group
Matt Sleeps full-funnel Black Friday results (3× purchases, +128% traffic), Think with Google (Feb 2025). Google Business
HEYDUDE Amazon DSP + Buy with Prime outcomes (11.4× ROAS, 47% NTB, +13.3% AOV; +3.9% purchase-rate lift), Amazon Ads case study (2025) and Buy with Prime customer story (Mar 2025). Amazon Ads Buy with Prime
Key sources & corroboration:
How to read it:
Startup (pre-scale / <$5–10M GMV)
Growth (multi-channel / $10–50M GMV)
Scale (>$50M GMV / omnichannel)

Let's set the murder scene.
Content marketing had a good run.
It climbed from scrappy blog posts to multi-channel dominance, propped up by armies of freelancers and SEO strategists.
Then AI showed up like a Hitchcock villain with a smile and a knife.
Suddenly, the rules changed.
Content didn’t just get disrupted—it got dumped in the river wearing cement shoes.
Here’s the body count.

Remember when $100 blog posts were considered bargain-bin content?
Those were the glory days.
Now AI will crank out 1,000 words in less time than it takes you to make a bad cup of office coffee.
The result?
Entry-level and mid-tier freelance writers are being pushed out of the market faster than you can say “per-word rate.”
It's only one of the reasons we continue to see former inexpensive writers reaching out through our various sites peddling their content writing services.
Unfortunately, the glory days of remote-writer positions is dead.
On the technical side, large language models (ChatGPT, Claude, Gemini, LLaMA, take your pick) can spit out entire content calendars overnight.
For businesses, that means cheap, instant, infinitely scalable copy.
For human writers, it means the floor just dropped out.
Only market research specialists, storytellers, or industry insiders with unique insights are surviving this purge.
The content mills that used to churn out 500-word keyword soup just met a chef that never sleeps.
And guess what? AI is infinitely faster, cheaper (errr...free), and just as bland.
AI can mass-produce “10 Best CRM Tools” or “Top 7 Ways to Lose Weight with Intermittent Fasting” at industrial scale.
The affiliate sites (a.k.a. content farms) that once thrived on churning out formulaic fluff now face stiff competition from a machine that doesn’t demand benefits or bathroom breaks.
Add insult to injury: Google’s Helpful Content Updates and AI-detection algorithms are sniffing out generic sludge faster than ever.
The strategy of “more is more” died with AI’s arrival.
Now it’s about authority, originality, and actual experience.
AI didn’t just kill your content strategy—it stole your keyword list and set it on fire.
Long-tail keywords used to be a clever way for scrappy businesses to outrank the giants.
But AI models are trained on long-tail queries.
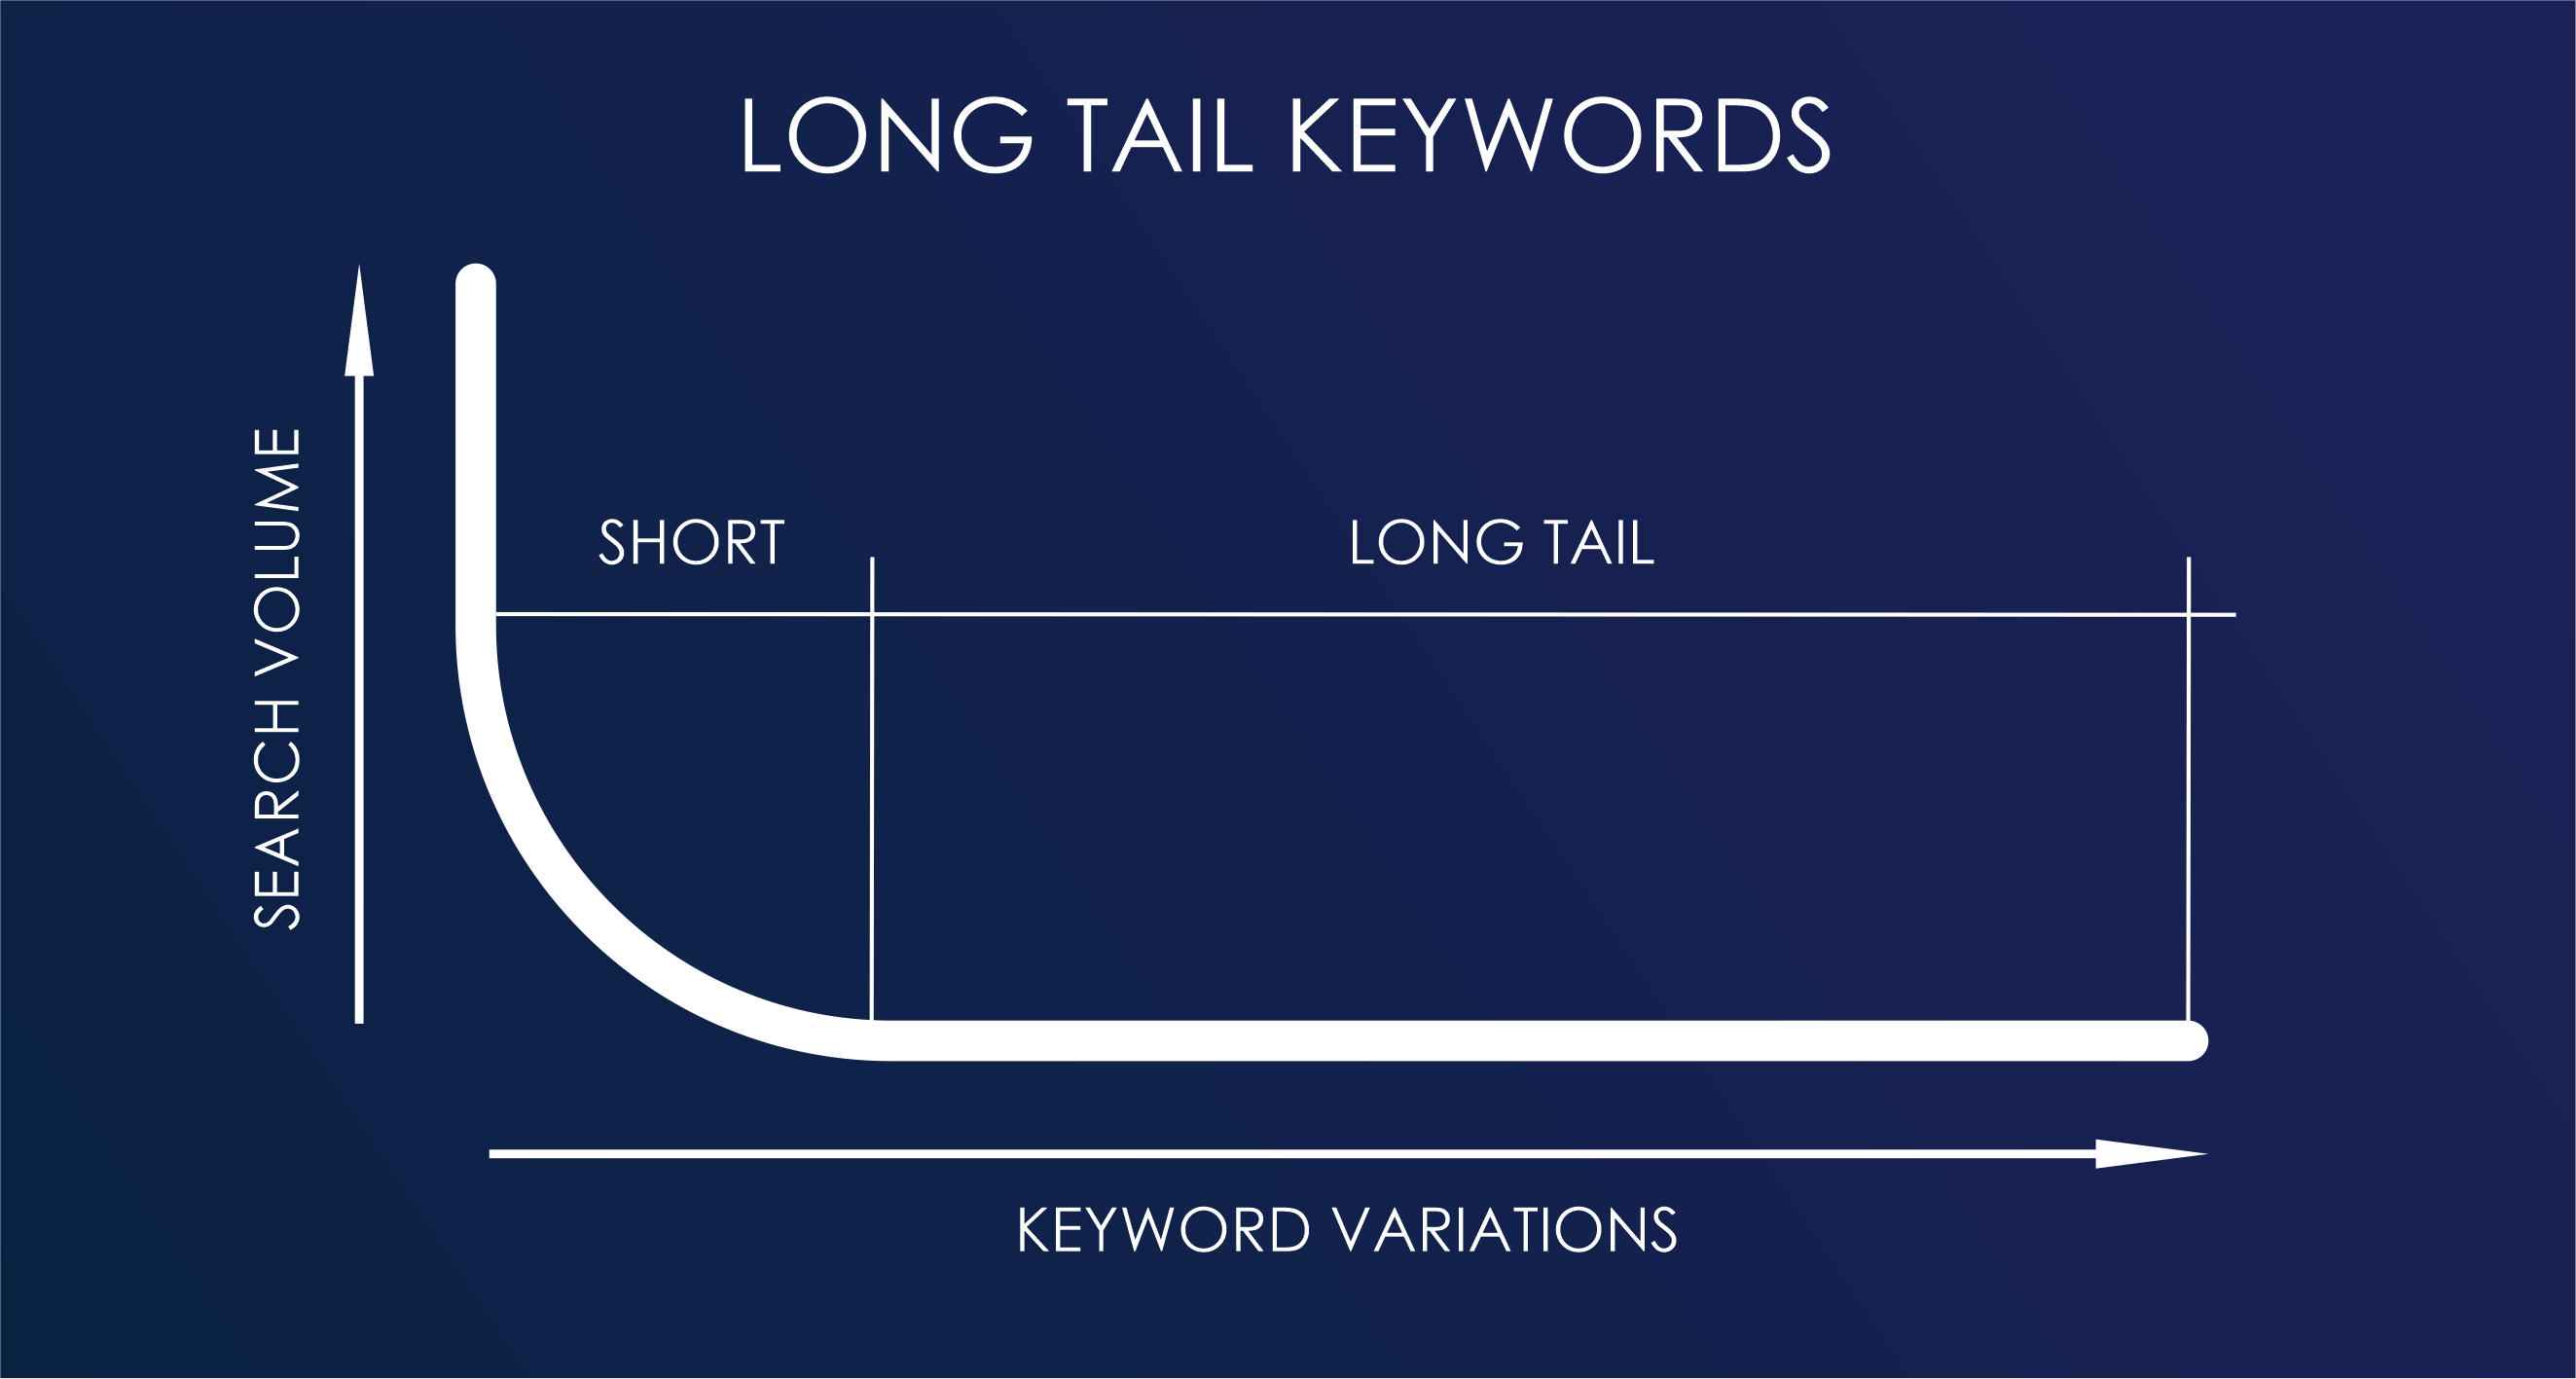
They know the obscure, weird, conversational phrases people search and how to answer them in an expanded way.
And instead of sending traffic to your carefully optimized blog post, AI often just answers the query directly.
Zero-click search is the new sheriff in town.
That means you can’t rely on ranking for “best ergonomic mouse under $30 in 2025.” AI already has an answer—and it’s not citing you.
When everyone uses the same AI, everyone sounds… exactly the same.
How many times have you read a blog post that starts with, “In today’s fast-paced digital world…”? That’s AI homogenization in action. It flattens tone, style, and originality into one beige voice.
For brands, that’s a death sentence.
Voice and differentiation used to be competitive advantages.
Now they’re diluted unless someone with a pulse (and an opinion) steps in to edit.
Real differentiation today comes from proprietary insights, creative storytelling, or just having the guts to be bold.
Why pay for steak when you can get free spam?
The explosion of free, AI-generated content has gutted the perceived value of content itself.
White papers, blog posts, and even eBooks feel cheaper because the supply has ballooned to infinity.
When everyone can produce an instant article, no one wants to pay for one.
The economics are brutal: supply floods, demand sags, prices collapse.
What is the only content with real market value now?
Things AI can’t easily fake—original research, expert interviews, proprietary data, or high-production multimedia.
Everything else is in a proverbial race to the bottom.
Okay, so the crime scene looks bad.
But not all content is toe-tagged.
Some is still alive and kicking—if you know where to look.
Content isn’t dead. But if you’re publishing beige AI sludge, it’s already in the morgue.
Let’s tally it up:
AI didn’t just disrupt digital marketing content—it left the chalk outline for everyone to see.
The survivors?
They’re the ones who stopped treating AI like a ghostwriter and started treating it like an amplifier.
Because in the end, AI didn’t kill all content.
It just killed the lazy stuff.
Ready to scale your digital marketing with AI?
Get in touch with us today to start the conversation.

Google’s AI Overviews have completely changed the way search engines bring websites relevant traffic. Before overviews existed, users had to click through search results and read page content to find the information they were looking for. In the process, business owners were able to generate sales, leads, web traffic, and brand awareness from those clicks. Some searches ended without clicks, but it wasn’t as common. Now we’re in a zero click world.
Users still perform more searches than ever, but fewer of them result in clicks. According to a SparkToro study, since 2024, 58.5% of U.S.-based Google searches have ended without users clicking any links. On mobile devices where convenience is critical, 75% of searches end without clicks. And it’s not because users aren’t finding what they need, but because the AI search engines and AI-generated overviews are answering their questions at the top of the page, without having to visit external websites. AI overviews aren’t always accurate. In fact, sometimes AI-generated responses can be outrageously inaccurate. Still, users seem satisfied with the information they’re being given.
Because of AI Overviews, many business owners are starting to notice a drop in organic traffic, especially in retail, travel, and media. This massive shift requires business owners to reinvent how they approach digital marketing strategies designed to generate visibility, authority, and conversions online.
A zero-click search is exactly what it sounds like: a search that results in zero clicks. The user types a query into the search box, hits enter, and then for whatever reason, they don’t click on any links. In the past, zero-click searches were usually the result of users refining their search or giving up. Today, it’s the opposite – users are finding what they need in the AI overview box and don’t feel it’s necessary to click on any search results to explore further. It’s because zero click search features like featured snippets, snippets knowledge panels, and AI-generated responses are doing the job upfront. In today’s zero click search world, users get fast answers without leaving the results page. This shift in search behavior is redefining how traditional search engines work.
Google’s AI Overview feature has been around since May 2024, and it’s just one of many features that continue to reduce traffic from organic search results. Between Featured Snippets, Snippets Knowledge Panels, Voice Search, People Also Ask boxes, and AI Overviews, clicks have been down by nearly half compared to what they were before 2022. AI search has taken things further by combining information from multiple external websites into a single response. Even news outlets are experiencing fewer clicks since Google is summarizing news articles as well.
This shift has real consequences for business owners. Even if your website ranks well in search engine results, users may never click through, which means fewer site visits. Your content might get featured in an AI Overview or Featured Snippet, but that still doesn’t guarantee clicks. That’s the reality of the zero click future.
In May 2024, Google launched its Search Generative Experience (SGE) to provide users with a summary of their search query. SGE uses content from numerous web pages to provide users with a quick overview that summarizes key information so the user doesn’t need to click on a dozen links and read a bunch of content. These AI engines prioritize clarity, accuracy, and authority. They rely less on traditional keyword signals and more on context, trust, and relevance.
· How Google selects sources. Around 52% of the pages used to create AI Overview summaries are typically ranked in the top 10 for the given query. According to Ahrefs research, 99% of Featured Snippets come from pages that already rank on the first page. This makes ranking in the top 10 critical for getting clicks from Google’s AI-generated results.
· The adoption of AI Overviews. Currently, AI Overviews show up in 30-35% of U.S.-based Google searches, with an even bigger presence for queries related to problem-solving.
· How click-through rates are impacted. Even though Google includes clickable citations in AI Overviews, many website owners are noticing a decline in website traffic. Despite clickable citations, a large percentage of users are satisfied with the overview.
While many sources still come from top-ranking pages in search engine results, being ranked number one doesn’t guarantee website traffic anymore.
Users see the answer and move on.
That’s a major shift from how traditional search algorithms used to work.
Now that zero-click searches are dominant, Google’s AI summaries are changing the fundamentals of SEO.
· Traffic. Although clicks were never guaranteed, ranking in the top positions in the search engine results pages (SERPs) used to be an excellent way to get website traffic to your website. Today, ranking number one no longer means getting the lion’s share of clicks and site visits.
Higher rankings are still better than being buried on page 10, but even web pages that rank in position one are seeing a significant loss of clicks. In fact, MailOnline reportedly loses over half its clicks when an AI Overview appears in Google’s search results. If users are satisfied with the AI-generated summary, they won’t even scroll down to the actual search results, let alone click on any links.
However, if you rank in the top positions, Google might use your content to write an AI Overview or Featured Snippet, but that doesn’t guarantee clicks, either. Users won’t necessarily click through to your website’s citation after reading the AI summary.
· Visibility. AI overviews take up even more space at the top of the page, forcing organic search results down even further out of view. Between featured snippets, snippets knowledge panels, and AI summaries, search engines are prioritizing answers over links.
· Keyword density. Keyword stuffing has been dead for a long time, but even just using relevant keywords and phrases has been weakened by AI engines. Keywords alone can’t compete with the power of citations and trust determined by a well-trained AI algorithm.
· Metadata is different. Since the name of the game has now shifted to getting your content cited in AI Overviews, metadata is important in a different way. For instance, Schema markup helps AI search engines understand your content better for use in overviews and improve your chances of appearing in zero click search features.
· EEAT is essential. Google’s EEAT framework (Expertise, Experience, Authoritativeness, Trustworthiness) has always been important for ranking, but now it determines what content gets cited in AI Overviews.
In short, SEO has evolved from simply maximizing keywords and phrases to building trustworthy, authoritative content. This shift has been happening for many years, but with AI engines running the show, it’s much harder to trick the system into thinking content is genuinely authoritative.
Google’s AI-generated summaries don’t seem to be going away anytime soon, so it’s critical to have a content strategy that works with this new zero click search world to avoid being left in the SEO dust. In addition to ranking, your content needs to be visible to AI search engines, worthy of being cited, and enticing enough for users to click. Here’s how that’s done:
· Lead with concise and accurate answers. To get AI algorithms to pick your content for summaries and overviews, you need web pages with clear, concise answers at the top of the page, followed by a deeper context. This is the structure that AI will understand best when choosing citations. Short, direct explanations increase your chances of being featured in featured snippets or ai generated responses.
· Use structured data. Schema markup is essential for getting content chosen for AI summaries. Use formats like “FAQ” and “HowTo.” Websites that correctly apply FAQ schema see a significant increase in traffic.
· Get specific and detailed. The more specific your content is at addressing topics, the better. AI tends to favor case studies, examples with dates, and quotes from experts. This signals high value, trustworthy content.
· Position yourself as an authority. Demonstrate EEAT through your credentials, citing your sources within your content, and publishing author bios. Detailed examples, stats, and expert insights improve your authority across external websites. AI algorithms view this information as trustworthy.
· Optimize your content for direct answers. Content optimized for direct answers (answer engine optimization or AEO) will get better visibility. For instance, create FAQ sections, paragraphs with definitions, and short summaries inside longer pieces of content. Strong presence across marketing channels and other marketing channels builds trust signals that AI systems recognize.
When clicks from search results drop, you need a different strategy for measuring performance and results. Here are five ways to overhaul your tracking system to fit in with the new AI-powered paradigm.
Clicks to your website might be the ultimate goal, but now that there are barriers in place, AI citations are the new goal. Start tracking where your content shows up in AI citations using Semrush or SurferSEO, AI search results, featured snippets, and other zero click search features.
A lower CTR used to indicate that users aren’t seeing your content. However, a lower CTR today might be offset by higher visibility in AI overviews. In other words, they see your content, but just don’t click.
In Google Search Console, filter queries that are triggering AI Overviews. Compare the impressions to clicks before and after this feature rolled out.
Branded searches still generate clicks, drive traffic, and should be optimized for conversions and site visits.
AI Overviews are generated from authority mentions and quotes. Use social and brand monitoring tools across marketing channels to manage your reputation and improve the way AI Overviews mentions your brand and reduce reliance on traditional search engines.
When you’re getting fewer clicks because of Google’s AI Overviews, your offsite link building strategy needs more power. In addition to a strategy for ranking, you need a plan that includes the following:
· Authority building through brand mentions. You need citations from trusted sources, like blogs, publications, and expert roundups to get AI to rank your content for inclusion in AI summaries. You’re building authority across external websites so AI engines trust your content.
· Authority positioning. It helps to be well-represented in terms of your brand across authoritative sources, like Wikipedia entries, about pages on your website, and various profiles across the web and marketing channels.
· Diversified traffic sources. Zero-click search highlights the importance of not relying entirely on Google for your traffic. It’s wise to invest your time generating traffic from email marketing, social media, partnerships, and customer/client referrals. Diversifying traffic sources also protects you from losing website traffic in the zero click future.
· Generate high-quality citations. When you can earn quotes and data references in respected publications, it will signal depth and trust to the algorithm that creates AI Overviews.
The tools and strategies in a zero-search world are still evolving, but for now, start using these basics:
· Platforms for AI optimization. Tools like Semrush, Ahrefs, SurferSEO, and MarketMuse offer AI Overview analysis and snippet alignment. For example, Semrush’s Position Tracking tool will tell you what keywords trigger AI Overviews and whether or not your site was included in the citations.
· Generative Engine Optimization (GEO). Leverage AI-specific metadata. For example, many website owners are starting to use the llms.txt file to help large language models understand and process their website more easily. This is a simple markdown file that provides a structured overview of a website’s content specifically tailored to LLMs. For example, the file includes summaries, important links, and contextual information to help LLMs avoid HTML and use the content to answer questions more easily.
While there’s still a debate regarding whether or not this actually makes a difference, it doesn’t hurt to experiment. Considering how crucial sitemaps are for search engines, it makes sense that llms.txt could become equally essential in the near future.
· Use ChatGPT to refine content. Start prompting ChatGPT to simulate AI Overviews and test if your content is used.
· Regular content audits. As always, continue performing regular content audits, improve FAQ sections, revamp content, and update data to ensure your content stays fresh for AI. Keeping your content fresh improves your chances of appearing in AI-generated responses and featured snippets.
All the traffic lost to AI Overviews may not be as bad as you think. Losing traffic isn’t inherently a problem if that traffic doesn’t convert anyway. If you’ve lost website traffic since AI Overviews were introduced, but your leads and sales haven’t dropped, you probably don’t need to worry too much.
When users are satisfied with an AI Overview, they’re probably not looking to buy and are still at the top of the funnel gathering information about a given topic. Many zero click search queries come from users who are still researching. They aren’t ready to convert. While it’s important to capture leads at all stages of the customer journey, users who simply gather information from an AI Overview and bounce are not going to buy from you right away. This means the queries that end in zero clicks aren’t going to be your most immediately profitable search terms.
Start creating and ranking content for AI queries that indicate a user is ready to buy. Users who are ready to buy and are actively looking for products and services will continue scrolling to the organic search results. That’s how you win in a zero click search world.
We have officially entered a new world where zero-click searches and AI-generated summaries are the standard. While traditional rankings are still important, they no longer guarantee visibility or traffic. In 2025, SEO means optimizing your content to be seen and cited by AI engines, not just to get clicks. Business owners who can align their content with answer engines through structured, authoritative, conversational content will dominate the new search world. The future belongs to brands that understand search behavior, build authority across external websites, and adapt to the zero click future. Those who don’t will quietly vanish as AI answers take over the top real estate in the SERPs.
If you’re watching your search traffic drop, wondering how to stay relevant now that AI Overviews have changed the game, you don’t have to figure it out on your own. Our team of digital marketing experts can help you adapt to the future by optimizing your content for visibility, authority, and conversion through SEO as well as professional digital marketing strategies. Contact us now for a free consultation and let’s turn AI-powered search into your competitive advantage.

If your business is doing the same old thing and continually getting inadequate results, it’s time for change. The marketing landscape has changed fast and the digital age is now upon us. And while the old ways of running marketing campaigns can work in some situations, you’re making a mistake by ignoring digital marketing.
Consumers are a fickle bunch and are becoming more skeptical of direct advertisements. They’re more likely to be convinced to make a positive purchasing decision by relying on personal recommendations and sources they find authentic and dependable. This considerable shift in consumer behavior has contributed to the increasing importance of influencer marketing.
The growth speaks for itself. Influencer marketing has become a core part of modern marketing efforts, not just a trend. Statista reports that the worldwide influencer marketing segment was worth $21.1 billion as of 2024. That's more than triple since 2019. It adds that the influencer endorsement market continues to mature as a sector and that the size and worth of influencer marketing platforms continue to grow each year, making strategic partnerships between brands and creators increasingly profitable. Marketers in the know are leveraging the power of the movers and shakers on social media to communicate their unique value propositions to potential customers.
Influencers with a strong social media presence and sizable list of online followers can be help move the needle on the influencer marketing lead generation front. But how exactly does influencer marketing drive lead generation? Keep reading to learn more about how influencer marketing impacts lead generation -- and how Digital.Marketing can help you maximize your influencer marketing strategy.
Influencer marketing is a type of social media marketing. There were 5.56 billion internet users globally as of February 2025, which makes up 67.9% of the worldwide population. Meanwhile, the number of global social media users comes in at 5.24 billion, making up 63.9% of the global population. That’s reason enough for every business to develop online marketing strategies. Failing to do so means losing out since your rivals are likely already targeting people online.
Businesses pursue influencer marketing because it enables them to reach a wider target audience through trusted sources who come with loyal followers. That can lead to higher engagement and conversion rates versus traditional marketing. For influencer marketing to work effectively for your business, the influencer and the influencer’s audience should be part of your company’s target demographic so that endorsements are impactful and yield results. These creators have built personal relationships with their followers, and that connection carries weight.
With billions of people online and active on social platforms, brands have an opportunity to meet people where they already spend their time. The right influencers can introduce your product in a way that feels natural, not forced.
Types of influencers include:
Which type of influencer your company works with will depend on what you’re looking to achieve and how much you want to invest. Micro influencers and niche influencers often drive stronger engagement metrics and better lead quality because their audiences trust them more deeply. That’s where working with Digital.Marketing, a business specializing in cutting-edge lead generation strategies, can help you come on top. We specialize in helping businesses ranging from startups to Fortune 500 companies with choosing the right influencers and other digital marketing strategies.
Influencer marketing lead generation works because it meets people at the intersection of trust and attention. Instead of interrupting, it blends into influencer content people already enjoy.
There are at least five ways that influencer marketing generates leads. Here’s an overview:

With more than 50 million influencers worldwide, businesses have plenty of options to work with. But that doesn’t mean your company can succeed with just any influencer. It’s important to do your homework and find an influencer with followers that are natural fit for your brand.
The truth is that the right fit matters and can make or break your digital marketing strategy. Depending on who you ask, businesses should invest between 5% and 10% of revenue on digital marketing. When earmarking that amount on anything, you need to know what you’re doing. Otherwise, you might fritter away financial resources on strategy doomed to failure.
Here are some things to consider to ensure you get maximum impact when using influencer marketing for lead generation:
1. Find the Right Influencers
2. Create a Clear Campaign Strategy
3. Run Special Promotions
5. Track and Measure Performance
6. Establish Long-Term Relationships with Influencers
When developing an influencer marketing strategy, you’ll want to avoid missteps. Making any of the following mistakes will lead to wasted time, effort, and valuable financial resources:
1. Choosing the Wrong Influencers
2. Ignoring Authenticity
3. Failing to Set Clear Goals and KPIs
4. Failing to Track Performance and ROI
Influencer marketing has become a reliable driver of lead generation -- giving companies another way to find, reach, and engage with their target demographics. But understanding the importance of influencer marketing and developing a winning strategy that yields measurable results are two separate things.
Influencer marketing lead generation isn’t just another tactic. It’s becoming a core part of how brands connect with people.
As the marketing landscape continues to evolve, businesses that focus on real relationships will stand out. That means building partnerships, not just running influencer campaigns.
When done right, influencer collaborations can help you attract potential customers, create content that resonates, and turn attention into action.
If you’re willing to invest the time to find the best influencers and build meaningful partnerships, the payoff can be significant.
At Digital.Marketing, we have the expertise to ensure you get results, including a measurable ROI. Get in touch today to learn how we can help -- whether you’re a startup, a Fortune 500 enterprise, and somewhere in between -- to develop an impactful influencer marketing plan.


AI chatbots have revolutionized our approach to communication and customer service in many industries. They are powered by Artificial Intelligence (AI) technology to generate dynamic, intelligent responses based on keywords or phrases detected in the conversation.
By leveraging Natural Language Processing (NLP), AI chatbots can better understand specific contexts and deliver tailored answers accordingly.
ChatGPT is an advanced AI platform that takes this a step further with its diverse capabilities, offering users more accurate information retrieval and refined conversations even for complex challenges.

AI models like ChatGPT are revolutionizing the landscape of AI chat through their advanced natural language processing (NLP) capabilities. Utilizing a large-scale transformer model trained on an extensive dataset of dialogues, ChatGPT provides high accuracy and understanding for human conversation and generates AI-generated responses that are fluent in style with improved cohesion across conversational turns.
It has also been optimized for both open-ended dialogue scenarios as well as specific query resolution systems. Leading chatbot software like these are essential in building the foundation for more sophisticated and effective AI assistants that understand human language in a natural manner. The ability of AI chatbots to work seamlessly across various interactions makes them indispensable tools in modern communication.
Through deep learning algorithms and preceding context sequences, ChatGPT-generated responses are able to draw associations across conversations from a number of nodes simultaneously to better provide solutions or understandings.
For instance, when asked follow up inquiries such as "What about X?", ChatGPT can draw on its recent discussion points and add pertinent answers accordingly in the same overall conversation thread.
Furthermore, these kinds of conversational abilities allow fewer interruptions from humans and create a more natural, human-like response.
This level of contextual awareness is particularly valuable in customer relationship management, where AI-driven interactions can enhance customer engagement and support.
ChatGPT's NLP capabilities are revolutionizing how complex conversations and queries are handled by AI chatbots. With its advanced language understanding and generation, it is now more adept at understanding contextual cues which enables it to provide detailed, accurate responses based on specific user inquiries.
The system also has enhanced memory robustness resulting in millisecond responses regardless of the nature or depth of the query.
As each request increases in complexity, the technology maintains highly efficient transaction speeds while providing superior customer service in a natural, engaging conversational style.
Additionally, as AI agents continue to evolve, they are becoming more adept at integrating AI image generation alongside text-based conversations, enhancing user experience across multiple domains. The best AI chatbots will continue to refine their capabilities, ensuring seamless interactions that closely mimic real human communication.

SourceChatGPT offers a natural and engaging conversational style to users. With its complex understanding of dialogue and immersion in language advancements, it produces accurate, prompt, and detailed responses that stimulate individuals as though the chatbot was a real person.
Additionally, ChatGPT features social skills such as recognizing emotions which aids in a more interactive user experience by making users feel comfortable with talking.
By continuously learning from interactions with people ChatGPT is able to enrich its knowledge of vocabulary as new expressions or terms are used in conversations, and keep up with language trends.
Therefore ChatGPT executes conversational AI interactions seamlessly, Elevating customer service while simplifying manual tasks for staff.
Enhanced user experience through personalized responses has pushed the boundaries of AI chatbot interaction for customers. ChatGPT responds in an even more natural and engaging tone customized to each conversation or thread.
Conversations are extended by proactively providing customers with relevant information requested and also suggested results as per their conversations to speed up response times. Customer engagement is improved when bots can target key interests, naturally adjusting conversation pacing and content based on current responses.
ChatGPT is equipped with the ability to handle multiple user queries simultaneously. This allows organizations to save time and improve efficiency by handling an entire conversation as one query rather than individual statements.
The tool also provides users with highly relevant, accurate responses quickly while providing a natural conversational intuition that puts humans at ease. In addition, it offers personalized marketing responses based on individual interaction history which empowers even more engaging interactions between chatbot and user. To ensure effective learning integration too, feedback is recorded from every interaction.
SourceThe adoption of AI-enabled chatbots has enabled organizations to move promptly and accurately turn around customer inquiries.
Expanding an agent's domain knowledge base is integral in providing timely and accurate responses that draw on a comprehensive base of information such as product features, services, industry trends, or technologies.
To avoid silos between model specializations, chatbot developers are now turning towards ChatGPT for sophisticated and multi-domain training modules which can collectively inject context to user queries from varied topics.
The ability to access vital, up-to-date information improves the effectiveness of AI chatbots. ChatGPT empowers this by providing comprehensive training on diverse topics and industries ranging from cognitive science and natural language processing to health care and sports.
Furthermore, webhooks in ChatGPT allow for real-time integration with external APIs enabling the quick transition from mere knowledge acquisition to practical implementations such as complex Q&As for customer service solutions or automated report generation in enterprises.
All this make it easier than ever before to take advantage of advancements in a huge variety of domains and stay totally up-to-date.
ChatGPT has the ability to extend its area of knowledge beyond the conversational domain. Not only can it remember earlier inputs and conversations, but it is also able to synthesize additional related data from external sources.
The training datasets feed into ChatGPT’s topic-specific knowledge bases, which allow its responses to be more accurate and relevant in real-world applications. Training on diverse topics also allows ChatGPT’s accuracy and wealth of language skills within any area or industry to evolve.

Advancing ethical AI practices is an important element in harnessing the full potential of chatbots. Unbiased and inclusive responses must be ensured at all times to avoid misframing data.ChatGPT through its training approach ensures that specific policies are embedded within response metrics when responding to user queries, offering valuable protection against discrimination and imbalance powered by prejudicial classification systems from chatbot responses.
To ensure the responsible deployment of AI chatbots, measures must be taken to mitigate potential risks associated with malicious use. ChatGPT features a continuous review system designed to identify any inappropriate or possibly harmful content among user responses.
Through its automated monitoring and reporting capabilities, it can alert stakeholders about suspicious behavior quickly and accurately in order to take corrective action right away.
Advancements in ethical AI digital marketing practices seek to ensure responsible navigation of the complex opportunities and challenges presented by new technologies. Mitigating risks associated with malicious use becomes increasingly important as individuals interact with chatbots on a regular basis.
To prevent adaption or manipulation of the conversational system, extra measures need to be put into place, such as reputation protection techniques and code obfuscation to reduce digital footprints.
ChatGPT's detection systems allow developers and users to actively monitor for misinterpreted instructions, off-policy behavior and misuse of data, giving the AI technology greater reliability and peace of mind.

Pioneering Continuous Learning and Adaptability is a key capability of ChatGPT. It allows for an artificial intelligence chatbot that can naturally evolve to become smarter, faster, and more accurate with age in response to user interactions. By “learning” from each interaction it gains understanding and recognition of patterns so that future conversations are tailored to the user’s preferences.
In addition, it seamlessly integrates new data without having to repeatedly adjust its training datasets while constantly striving to provide better results as a result of feedback from user interactions.
By learning from each user and conversation it participates in, ChatGPT is able to build up knowledge in order to provide expected responses with improved accuracy rates and an ever-advancing level of capability.
This process is facilitated by advanced architectures that draw from comprehensive training datasets containing millions of conversational utterances to allow the ChatGPT bot to better understand contextual nuances and intent.
Ongoing feedback loops between users, trainers, and domain experts work hand-in-hand with the learning framework to ensure an ongoing dialogue, enabling the system to continuously learn new skills and deep dive into domain-specific knowledge.
In addition, the chatbot can be trained on a continuous basis through leveraging adaptive learning enabling models to evolve at an unmatched rate.
Through continual training with relevant datasets combined with feedback from users, ChatGPT evolves its responses in order to offer personalized services and greater accuracy.
With advanced conversational machine-learning techniques, this AI-powered chatbot is efficient at spotting subtle changes in understanding human interactions and adapting its response accordingly—ensuring that user questions are answered quickly and accurately according to their current needs.
This is an invaluable and revolutionary capability that moves AI chatbots closer to "real-world" levels of conversational ability and problem-solving.
The potential for misinformation and false information propagation is an important limitation of AI chatbots, specifically ChatGPT. Without proper implementation of ethical AI practices, results generated by the chatbot may have inaccuracies or convey prejudice implications, both of which can lead to a skewed user experience.
Machine learning algorithms ingest learnings from large volumes of data and signals from previous conversations - as such, maintaining accuracy requires being extremely selective in the type of data used as well as employing rigorous integrity checks during training sessions.
Addressing ethical concerns and biases when deploying AI chatbots is a critical component often overlooked. Questions surrounding data privacy, questions of purposeful or accidental implicit bias, and other moral issues can reduce user trust levels.
Tackling those types of ethical concerns requires technology to conform to certain values such as conduct rule decision orientations. Additionally, by enhancing transparency and building auditing capabilities we could gain better insights into awareness from users on potential unfairness cues produced by chatbot interactions.
Data security and user privacy remain the foremost challenges when it comes to developing and deploying AI chatbots. This becomes even more problematic where real-time data that is fed into these chatbot systems holds private information and needs to be encrypted.
Balancing compliance with regulation standards like GDPR along with engineering limitations brings forth complexities that need to be taken seriously if building trust is important. Moreover, a single infringement could lead to reputational losses or legal issues down the line for companies using or connected with an AI Chatbot system proving its essential importance.
ChatGPT has shaken up the field of AI chatbots, transforming it from a limited technology hub to an innovative powerhouse. Its advanced language understanding and use of NLP give ChatGPT significant capabilities in user interaction, domain knowledge, ethical practices, and continuous learning.
With the right tools and AI strategy put in place for how they are used responsibly and ethically, ChatGPT is truly an exciting breakthrough that holds great promise not only inside the current realm of chatbots but for so many other future possibilities with artificial intelligence technology.
Regulatory frameworks must be implemented to ensure appropriate usage while preserving user privacy and security. As this space continues to progress there will remain more obstacles yet also opportunities ahead - all thanks to ChatGPT’s revolutionizing influence on AI chatbots.

If you’ve ever run PPC campaigns and wondered why clicks aren’t turning into real results, you’re not alone. Getting traffic is one thing. Getting people to take the desired action is another story entirely.
The truth is, your PPC conversion rate isn’t just about your ads. It’s the result of everything working together, from your ad copy to your checkout process, your targeting, and even your bidding strategy. When all of those pieces align, you start seeing stronger advertising performance and a higher number of conversions.
Let’s break down what actually moves the needle.

Once a user clicks on your Google ads, Bing ads, or other PPC platforms, it will be your corresponding landing page that drives home conversions. Well-designed landing page content reassures people that your site is trustworthy. A poorly designed page can give the impression that the offer might be a scam or low-quality.
High converting landing pages don’t need to be flashy. They need to feel clear, focused, and relevant. Think simple design, easy navigation, and messaging that matches the exact search queries people used. Make sure your landing page has the following elements:
If your page feels disconnected from your ad groups or keyword targeting, your PPC conversions will suffer.
There’s a direct link between relevance and conversion rate. Focused landing pages increase conversion rates. Instead of sending prospects to your home page and letting them explore your site, send them to a specific, dedicated, and focused landing page designed specifically for each offer. The more aligned your message is with user behavior and intent, the better your results.
This is where keyword research and ad relevance come into play. When you target specific keywords tied to high intent traffic, you’re not just getting clicks, you’re attracting potential customers who are ready to act.
The process of interacting with your ads and landing on your website should be a continuous experience. For example, if your ad promotes 10% off of cartoon-printed socks, the user will expect your website to present that exact offer. When they click on your ad, your landing page should be dedicated to that specific offer, depicting all the cartoon-printed socks you sell.
You don’t want to send people to your “Sock Company” home page because it breaks the continuity and that’s when a lot of people will bounce. To maximize conversions, keep your landing page focused on the offer in your paid ad. That’s how you move from average PPC conversion rates to something with significantly higher conversion rates.
Copy is just a fancy word for “text” and it happens to be one of the most influential factors in PPC conversions. Your ad may not have more than a headline and a few words as a description, but the right words can get more clicks and the wrong words can turn people off.
If you want to increase conversions, your ad copy needs to be persuasive. Your ad headline needs to be enticing enough to get clicks, and your landing page copy needs to be compelling enough to speak directly to your target audience, reflect where they are in the customer journey, and generate conversions, like sales or signups.
Writing persuasive copy isn’t easy when you aren’t a professional writer, so the best way to get a strong copy is to hire a copywriter who specializes in content marketing. If your ads feel generic, your PPC performance will reflect that. If they feel personal and relevant, you’ll see better conversion tracking results and improved conversion data.

Color is extremely important for your conversions. You won’t find many landing pages with bright purple “buy now” buttons for a reason – it’s not the right color.
While there are a variety of color schemes that can work, studies have shown certain colors to be more effective. For example, HubSpot conducted a test that put green against red. Normally, red is perceived as “stop” and green is perceived as “go,” so you might think the green button would win.
Surprisingly, the red button outperformed the green by 21%. This doesn’t mean red is the only color that works, but it seems to be highly effective.
The people you target are arguably the most important factor in your conversion rate. If the people who see your ads aren’t your ideal customers, you won’t get conversions. You can burn through ad spend fast and still struggle if you’re targeting the wrong people. This is the first place to start when optimizing your conversion rate.
Make sure your ads are targeting the correct market. This is where negative keywords and refined keyword targeting help filter out low-quality traffic. You might need to revisit your market research to ensure you have that market properly defined. A good PPC conversion rate depends heavily on your niche. Conversion rates by industry vary more than most people expect. For example, legal services often have very different industry averages compared to the technology industry. That’s why understanding PPC conversion rates in your space matters.
Looking at industry averages and sources like search engine journal gives you perspective, but your goal is improving your own conversion rate data.
It’s better to get fewer clicks from the right people than a flood that never converts. That’s one of the fastest ways to improve PPC conversion rate.
When people read your offer, how well your value is presented will influence conversions. People compare options across various industries all the time. If your unique selling proposition isn’t clear, you’ll lose them. You want your proposition to tell people why they should buy from you over the competition. A strong value proposition will help you generate more conversions and lower your cost per conversion and even your cost per acquisition over time. However, this isn’t easy to nail, so if you’re struggling to get it right, digital marketing services can help.
Anything that distracts visitors can prevent them from converting. Distractions include things like flashing animations, pop-ups irrelevant to your offer, form submissions that take too long, external links, and internal links that go to other pages on your website. Every extra step hurts your conversion rate.
To increase conversions, simplify everything. Make it easy to move forward. Keep your prospects on your offer page and don’t give them any reason to leave. The smoother your funnel, the better your conversion tracking and conversion data will look.
You can have the best offer in the world, but if you don’t directly ask for the sale and create urgency around following your CTA, you’ll miss out on plenty of conversions. It’s important to create a sense of urgency around your offer. You can use a countdown timer to a deadline or use other marketing tactics like offering a limited supply. Used correctly, urgency can improve your PPC conversion and drive better results across your entire campaign.
Testimonials contribute to the decision to buy. Not having testimonials on your PPC landing pages can hinder conversions. Good testimonials are the social proof many people need to make a purchase. In paid advertising and digital advertising, trust needs to happen quickly. Social proof gives that extra push and can increase your number of conversions significantly. According to Volume 8 of the Conversion Index created by Bazaarvoice, businesses generate 58% more conversions from visitors who read reviews and testimonials.
If your goal is to generate sales, the price point of your offer can influence or deter conversions. A price point set too low will make people think your offer is cheap. However, if your price is set too high, it can make people bounce.
The key is to set the right price for your offer and your target audience. Sometimes this requires adjusting your audience. For example, everyone would love to have a life coach, but if you want to charge $500 per month for your services, you need to target a more affluent client base.
Last, but not least, a good checkout process will ensure your inspired prospects continue with their purchase. If it becomes a struggle or something isn’t working right, people will bounce.
Always verify your checkout process to ensure it’s smooth and easy. For example, avoid forcing people to create an account just to buy from you, and make sure all shipping calculations are shown before the user enters their payment information. You can lose a lot of conversions with a frustrating checkout system.
Now that we’ve discussed all the factors that influence your conversion rate, it’s time to dive into increasing your conversions. If you want more sales, signups, and followers from your PPC ads, here’s how to achieve that.

You can’t improve your conversion rate if you don’t know which elements are contributing to or hindering your success. If you try to adjust your PPC ad campaigns to generate better results without this information, you might end up making the wrong changes.
The best marketers rely on b testing, split testing, and ongoing optimization. Testing your ad copy, ad spend, and keyword research strategy leads to steady gains.
Always run a split-testing campaign with your PPC ads and landing pages to identify successful elements and experiment to fine-tune your improvements. Over time, these improvements boost your conversion rate and overall advertising performance.
There are a handful of common technical causes for low conversion rates. For example:
Other factors that diminish conversions include:
Most of these factors are within your control and they’re not hard to improve. You can use the LIFT Model discussed in the next point to cover your bases here.
The LIFT Model consists of optimizing and managing six factors that drive conversions – Value Proposition, Relevance, Clarity, Distraction, Urgency, and Anxiety.
Chances are, that $5,000 item won’t generate immediate sales from your PPC campaign. That’s a big investment, and most people will need time to think before they act. One way to get around this is to use a tripwire. A tripwire is a lower-priced item that you offer people first. Once someone makes a small purchase, it’s easier for them to spend more money. This strategy can help boost your PPC conversion by moving hesitant buyers into your sales funnel.
To maximize its effectiveness, ensure your ad copy highlights the benefits of the tripwire offer. Tripwire is an effective method for earning trust and generating hot leads to nurture larger purchases through email marketing, and it can significantly increase your PPC conversion over time.
Companies that offer money-back guarantees are more likely to generate sales from hesitant prospects. While your average PPC conversion rates may initially reflect a slight increase in refunds, you’ll gain a generous amount of purchases to make up for it.
There are so many offers out there, and if your company isn’t already well-known, people will be hesitant to buy from you. Offering a money-back guarantee alleviates those concerns and makes people feel safer in their decision to buy. When combined with data from Google Ads averages, this can be a powerful way to fine-tune your PPC efforts and improve trust metrics. If you have an amazing product or service, it’s unlikely that you’ll get flooded with refund requests.
Even today, some people won’t use their credit card online, but they will use PayPal or Klarna. Make sure you offer credit card alternatives. Many consumers prefer PayPal because they offer protection for buyers, and it’s easier to resolve a dispute through PayPal than a credit card company.
Additionally, payment method variety can appeal to users on mobile devices, a key demographic for PPC ad platforms. If you're tracking your PPC conversion rate formula, consider how adding multiple payment methods could calculate PPC conversions more accurately and improve your overall sales funnel efficiency.
Whether it’s styles, colors, sizes, or other options, minimize the number of choices you offer. The more choices you provide, the fewer purchases you’ll get. This is backed up by the famous “jam experiment.” The results, published in the Journal of Personality and Social Psychology (JPSP, Vol. 79, No. 6), showed that grocery store customers presented with 6 flavors of jam to sample were ten times more likely to make a purchase than those presented with 24 flavors to try.
Are you ready to supercharge your PPC landing pages to get more conversions? Digital.Marketing can help. Contact us for more information – we’d love to work with you and help you achieve your goals!

If you’ve ever tried to run a content marketing program on your own, you already know the truth most people don’t say out loud. Content marketing sounds simple. Write a few blog post drafts, share them on social media, maybe shoot some video content, and call it a day. In reality, Content marketing is about more than just writing content. In order to be effective, your content needs to start with a strong foundation, be executed with a degree of expertise, be syndicated correctly and to the widest possible audience, and then be analyzed and revised for effectiveness. Content marketing strategy is easy to pick up but is difficult to master, as there are many different skills that must be honed for different stages of the content marketing process.
Behind every high-performing content team is a carefully thought-out team structure made up of people handling multiple functions. Some focus on big-picture thinking, others on day to day operations, and a few live deep in data analysis and optimization.
And here’s the part many small business owners miss: these roles don’t just support content creation. They connect directly to your overall marketing strategy, your sales funnel, and your broader marketing organization.
Whether you have a team of content marketers working for your company, or you’re a one-man operation trying to cover everything yourself, there are seven distinct content marketing roles your content team will need to perform in order to be successful:
The visionary, or the content strategist, is going to perform the first step of your content creation program: creating the tone and overarching themes of the campaign. Working closely with the researcher, the visionary is going to take inventory of previous company knowledge and set goals and direction for the campaign. This includes identifying buyer personas, setting the tone and brand voice for the content, establishing key content ideas and topics for the next blog post, and determining which types and formats of content to use throughout the campaign. The visionary will also be responsible for overseeing each additional step of the content marketing efforts, making sure each step aligns with business objectives, marketing goals, and long-term growth.
The visionary ensures that content marketing teams are aligned with the goals of the campaign, reflecting best practices in the content marketing industry. By focusing on content marketing initiatives that generate compelling content, they aim to improve search engine results pages and attract the right buyer personas.
They define your audience, map out your editorial calendar, and decide how your content marketing fits into your integrated marketing approach. They also make sure your work supports sales teams, customer success, and even operational professionals.
Without this role, content becomes noise. With it, you build a real competitive advantage.
The researcher’s job is to find and harness information that can be used for the betterment of the campaign. The researcher fuels the content team with valuable insights. They dig into keyword data, study industry publications, and analyze trends referenced by places like the Content Marketing Institute. They also evaluate gaps between traditional marketing and modern digital channels, including paid media, outdated direct mail lists, and missed opportunities in your marketing organization.
In the earliest stages of development, the researcher will feed data to the visionary, working together to form conclusions about the future direction of the company’s content production. In later stages, the researcher will find facts, gather statistics, and ultimately provide fuel for the production of individual pieces. As the campaign develops, the researcher may also be responsible for uncovering other types of information along the way.
The researcher will conduct market research and keyword research to identify trends and opportunities that will guide the campaign's strategy. By providing content writers with content briefs, relevant data and insights from their market research, they ensure that each piece of high quality content is well-informed and targeted.
This is where ideas turn into real content assets. The producer is the role most closely associated with today’s typical content “writer.” For the most part, the producer will spend his time coming up with titles and materials in line with the visionary’s initial plan, then writing up pieces of content that can then be put on the web. However, today’s producer is typically responsible for much more than just content creation across different content formats. That might mean writing, designing with a graphic designer, working with freelance writers, or producing video content and interactive content. With a target audience that demands multiple mediums of content including pictures, videos, and presentations, the producer is also responsible for developing alternate forms of visual content.
In many cases, this role overlaps with a content manager or content marketing manager. This means including multiple different producers, each an expert in a different realm, or outsourcing some of the work. They manage production flow, keep the content calendar on track, and ensure everything aligns with your content program.
A great producer also understands storytelling. They create brand stories that connect with audiences and support your marketing goals.
The optimizer serves as a revisionist and a front-line editor, ensuring that each piece of produced content fits in well with the overall themes of the campaign. For example, the optimizer could tweak the titles of the produced work to fit previously targeted keyword phrases or make design edits to an infographic to make sure the brand is more prominently displayed. The optimizer can also enhance different pieces of valuable content by adding new features and conversion tactics—for example, he could be responsible for sourcing and including relevant images for the body of written content, while ensuring everything aligns with your content management system. They also look at how content fits into your sales funnel and how it contributes to your overall marketing strategy.
This role helps your content team turn effort into results.
The editor’s role has two main functions. First, the editor, or content editor, is responsible for ensuring that there are no mistakes in the written work—including spelling grammar, syntax, and even fact-checking to ensure accuracy.
Second, the managing editor is responsible for overseeing the editorial calendar, coordinating team members, and publishing the material through the content management system. They often act as a project manager, keeping workflows organized and ensuring deadlines are met. Once the work is completed and the editor has signed off, it is his responsibility to post the material online or in social media platforms. In most cases, this only requires familiarity with a CMS, so that the content can be published quickly to the web pages.
Without them, even talented content team members struggle to stay aligned.
The syndicator is responsible for ensuring the visibility of the published piece, which is one of the most important parts of the process. The syndicator ensures distribution across social media, social media pages, and other channels. They schedule social media posts, manage influencer outreach, and sometimes collaborate with an outreach specialist. In some teams, this overlaps with a social media manager. In others, it connects to the larger marketing organization and integrated marketing efforts.
Once published, the syndicator will prepare the visionary’s selected channels, and schedule the post for distribution. This may include writing more concise headlines or teasing introductions, or it may include simply posting a link to the relevant content. It could also include paid media opportunities such as purchasing ad space or submitting published pieces to external sources for guest post consideration. Whatever the case, the syndicator’s core job in content marketing operations is to maximize the visibility and accessibility of the piece and drive customer interactions.
The analyst, or data analyst, has virtually no impact on the current campaign; instead, the analyst’s job is to measure the impact of the current campaign and use that information and key performance indicators to make recommendations for subsequent marketing campaigns. The analyst will determine the success of the content strategy at every level, measuring impact in terms of inbound traffic, post popularity, social signals, and other dimensions.
Also, the analyst will then make firm conclusions about the strengths and weaknesses of the campaign, as well as how each role performed in the team context. Once complete, the analyst will work with the visionary to convey this information and plan for the future and improve analytics setup, and the cycle will continue again. They help establish a proven track record by identifying what drives results and what needs to change.
This role supports leadership, including the marketing manager, and informs decisions across the broader marketing organization.
You don’t need a massive team. Many successful teams start small.
But understanding the right team structure is critical.
Content marketing isn’t just creative work. It’s a strategic function that connects traditional marketing, digital execution, and long-term growth.
When your content team is aligned, your efforts lead to sustainable growth and stronger results.
If you’re one of many small business owners, you probably can’t hire for every role right away. That’s okay. Early on, your content manager might also act as a content strategist. Your social media manager might handle outreach. You might even partner with a content agency.
These seven roles are critically important, but the best person for one role may not necessarily be the best for another. Do not make the mistake of assuming that one person can handle the overall content marketing strategy; while it is possible for one person to develop all these skills over time, if you want the best possible results, you might want to consider partnering with an outside expert. If you can fulfill these roles with individual, niche experts, you’ll set yourself up for a meaningful, long-term campaign. Over time, you can expand your content team, adding specialists like a creative director, project manager, or additional content manager support.
Modern content marketing blends creativity, distribution, and data.
When your content team reflects that reality, everything improves.
Your content gets sharper. Your messaging gets clearer. Your results become measurable.
And your content marketing finally works the way it should.

On the surface, lead generation and demand generation sound like different names for the same concept.
Leeds and demand definitely share a relationship. If you generate more demand for your product, you'll end up with more leads, and if you can generate more leads, you’ll naturally benefit from greater demand.
However, while there is some overlap between lead generation and demand generation, it's ideal for marketers to treat these strategies as distinct – and integrate both of them into your overall approach.
A lot of marketers use the terms interchangeably, lump them into one bucket, and move on. But demand gen and lead gen are not the same thing, and treating them like they are can quietly wreck your results. You might see some website traffic. You might even get a few new leads. But if your marketing strategies are off, growth stalls.
What exactly are the differences between lead generation and demand generation?
And why does your business need to use both?

Let's start with the basics.
Demand generation focuses on stimulating demand and interest in products like yours. This process is often somewhat passive and focused on inbound approaches, and it doesn't always result in newly generated leads or customers. Your target audience might not even know they have a problem yet. They feel pain points.
This is where creating demand begins. Strong demand generation efforts help people understand their problem and why it matters. In simple terms, demand generation creates context and urgency. It gives potential customers a reason to care. That’s why demand generation campaigns lean heavily on education and brand building.
The goal is to create a landscape in which more people are aware of your brand and the reason it exists – and in which people are primed to think about or even buy products like yours. You’re trying to create awareness and shape how your target market thinks.
Demand generation prioritizes the following:
· Introducing the problem. On the demand side of the equation, you typically focus on the problem more than the solution. If you're selling food, you first need to stimulate hunger. There's nothing wrong with introducing your solution or product at this stage, but the primary motivation of your actions should be to make people recognize that they need your solution or product.
· Highlighting brand authority. This is also an excellent opportunity to highlight your brand authority. Brand visibility and content marketing plays an important role in both demand generation and lead generation, but it's especially valuable to establish your authority before you attempt to call your prospects to action.
· Utilizing free and accessible media. At the demand generation stage, most people are going to feel somewhat apathetic toward your brand. That's why it pays to use free and accessible media. People are much more likely to read articles, watch videos, and engage with social media content if it's freely available, and that's exactly what you want in the demand generation phase.
· Engaging a wide audience. Demand generation also requires you to engage a wide audience. At this point, you're focused on quantity as much as quality, since you're effectively “priming the pump” of customer demand. You may not have a concrete idea of who your best customers are going to be, so it's beneficial to cast the widest possible net.
· Top of funnel focus. Demand generation prioritizes action at the top of the sales funnel. At this stage in the buyer's journey, people may not even be aware of the problem they're facing. It's your job to introduce that to them, so they can feel comfortable and confident moving to the next stage of the funnel.
These are all demand generation tactics that support demand creation.
When done well, generated demand leads to more engagement, more potential buyers, and more people who express interest in your company’s products. It also improves future sales because your brand stays top of mind.
Simply put, demand gen focuses on reaching a wide audience and building trust before asking for anything in return.
In contrast, lead generation is about taking advantage of the demand you've already generated so that you can cultivate more prospects and eventually customers. Instead of a broad audience, you focus on prospective customers and target buyers who are ready to move forward. Most companies practicing lead generation use a mix of both inbound and outbound strategies, across a multitude of different channels.
This is where lead generation tactics and lead generation techniques come into play.
Lead generation prioritizes the following:
· Introducing the solution. If you want someone to be interested in your product, you need to pitch it to them as a solution for a problem they know they're facing. If you have a good demand generation strategy in place, you probably have a multitude of prospects who are aware of a problem and are in search of a solution. This is your opportunity to introduce it to them.
· Highlighting specific benefits. Lead generation also enables you to highlight specific benefits of your product or service. There's nothing wrong with showcasing your brand authority and expertise at this stage, but if you want to convert people, you need to give them compelling reasons to do so. The more specific your pitch is, and the more persuasive it is, the better.
· Utilizing gated content and media. During the lead generation stage, you need to get something from your audience. Depending on your strategy, that could mean persuading people to buy your products and services or simply getting them to provide their contact information. Either way, you need to utilize gated resources or media. Give people better-quality, premium resources in exchange for their contact information.
· Engaging a narrow audience. Instead of casting a wide net, lead generation typically benefits from engaging with a narrower audience. There's nothing wrong with generating a lot of leads, but you're typically better served focusing on quality over quantity. This way, you can reach the people most likely to buy from your brand – and avoid wasting time on people who aren't a good fit for it. Many lead generation strategies also include processes for ongoing lead nurturing, capitalizing on quality leads who didn't convert the first time around.
· Bottom of funnel focus. In contrast to demand generation, lead generation focuses on the bottom of the funnel. By this point, many of your prospects are going to be intimately familiar with your brand and its products, so you'll just have to close the deal.
These generation tactics help with generating leads and turning them into qualified leads or even a sales qualified lead.
At this stage, lead generation captures real intent. Someone downloads something, signs up, or requests more info. These are actual leads, not just passive interest.
Good lead gen work is not about volume. It’s about attracting high quality leads that your sales team can move through the sales pipeline.
Because ultimately, lead generation converts interest into paying customers.
There are many good reasons why you might focus on demand generation as part of your overarching marketing approach:
· Countless options. For starters, demand generation gives you countless options. Because you're focusing on a broad audience, and not a highly specific one, and because you're more focused on getting attention and stimulating thought than driving specific action, you can engage with people in practically limitless ways. You can take advantage of dozens of different free channels and experiment with a wide variety of tactics to drive results.
· A big net. This is also one of your best chances to cast a wide net and appeal to as many people as possible. Not everyone who interacts with your demand generation materials is going to become a loyal customer, but you don't need them to. You simply need to raise awareness of the problem your brand is trying to solve and make your brand more visible.
· Long-term value. Demand generation is a long-term strategy that yields results for years to come. Even if someone who engages with your demand generation materials doesn't buy from your brand right away, your brand will become more familiar to them, so they're more likely to buy from you in the future. They may even be more likely to recommend your brand to friends and family members who are ready to buy. Because of these effects and others, you can capitalize on demand generation dividends indefinitely.
· Secondary benefits. There are also some secondary benefits associated with demand generation. It's not just about stimulating thought and interest in your products; it's also about reengaging with customers who have already bought from you and building the credibility and broader familiarity of your brand.
There are many perks associated with lead generation as well:
· Harnessing the full power of demand. Lead generation is the best way to capitalize on power of the demand you generated – as well as whatever demand already innately existed for your product. With a focused, targeted approach, you can reach out to the people who are most interested in your products and most likely to buy from you so that you can persuade them more specifically.
· Quality selections. If demand generation is more about quantity, lead generation is more about quality. Instead of spamming a million people in the vague hope that some of them will go out of their way to engage with you, you can reach out to the select few people most likely to engage with you – and appeal to them directly.
· Cost effectiveness. If your lead generation strategies are sufficiently effective, they should yield a very strong return on investment (ROI). Demand generation should have a positive ROI as well, but it's harder to measure and takes longer to develop. By optimizing your lead generation strategy for results, you can get more value out of every dollar you spend.
· Systematic clarity. Lead generation strategies give you much more concrete feedback to work with. If someone declines to purchase your product in a phone conversation, you can ask them what's holding them back. If some of your inbound tactics have a lower conversion rate than others, you can study the data to learn what the differences are and readjust your approach. As long as you take this feedback seriously, you can gradually refine your approaches and significantly improve your results down the line.
Do you really need both lead generation and demand generation? A couple of simple thought experiments can help you decide.
First, let's think about what a company might look like if it focuses on lead generation without demand generation. It's capable of achieving relatively high conversion rates and targeting the people most likely to purchase specific products, but people may not be familiar with the brand and there will be fewer people even aware that a problem exists. In this scenario, the company might be genuinely pleased with results; if traffic is reasonable and conversion rates are high, the company can achieve profitability and relatively sustainable growth.
However, this company might be blind to the potential it could achieve with the help of demand generation. Because demand generation produces more potential leads to target and enriches your customer pool by showcasing brand authority and building familiarity, it greatly multiplies the impact of your lead generation strategy.
If you rely only on lead generation strategies without demand generation efforts, your results will feel forced. You might generate some new leads, but many won’t be ready. Your conversion rates drop. Your marketing efforts become expensive.
Why? Because lead generation converts best when demand gen creates awareness first. Without that, you’re pushing instead of attracting.
An even clearer example of why you need both is a hypothetical in which you utilize demand generation without lead generation. Let’s say your demand generation campaigns are working. In this scenario, you've made thousands of people aware that there's a problem they need to solve – and you've potentially introduced your brand to them. You’re getting website traffic, engagement, and more potential customers. People understand their problem and recognize your brand. This will almost certainly have an impact on your bottom line, driving more people to your business and improving engagement with your existing customers.
However, you'll never be able to harness the full potential of your demand generation without lead generation tactics at the bottom of your funnel and sales pipeline. You may have more people aware of the critical problem, but you're not pushing people to take action, nor are you specifically targeting the people most likely to buy from you. That’s where demand capture matters. Without it, even strong generated demand doesn’t turn into leads generated or revenue.
Ultimately, the best approach for nearly every business is to use demand generation and lead generation together. With both of these strategies overlapping and connecting with each other, demand generation creates interest, lead generation captures that interest, demand gen focuses on education, and lead gen converts action. Together, they support the full customer acquisition process.
At the top, demand generation content helps create awareness and highlight pain points.
In the middle, gated content helps identify qualified leads.
At the bottom, lead generation converts those leads into paying customers.
This alignment helps your marketing team and sales team work together more effectively. It also makes it easier to nurture leads and improve long-term results.
Of course, this can be a tricky puzzle to solve. How much, exactly, should you be investing in each side of this equation? How should you use tactics that could conceivably fit into either demand generation or lead generation? How can you use insights gleaned from one strategy to improve the other? And what do you do if you hit a dead end?
If you're relatively new to the digital marketing world, or if you've had unsatisfactory marketing results in the past, you may not know how to begin answering these questions. That's why it pays to work with a seasoned marketing agency, which can offer the expertise and insights necessary to help you create and execute the best possible mix of demand generation and lead generation.
If you’re ready to get started, reach out for a free discovery call today or take a look at our ultimate guide to lead generation!

.svg)


.png)