


%20Market%20Research%20Report.jpg)

“How it works” + proof points
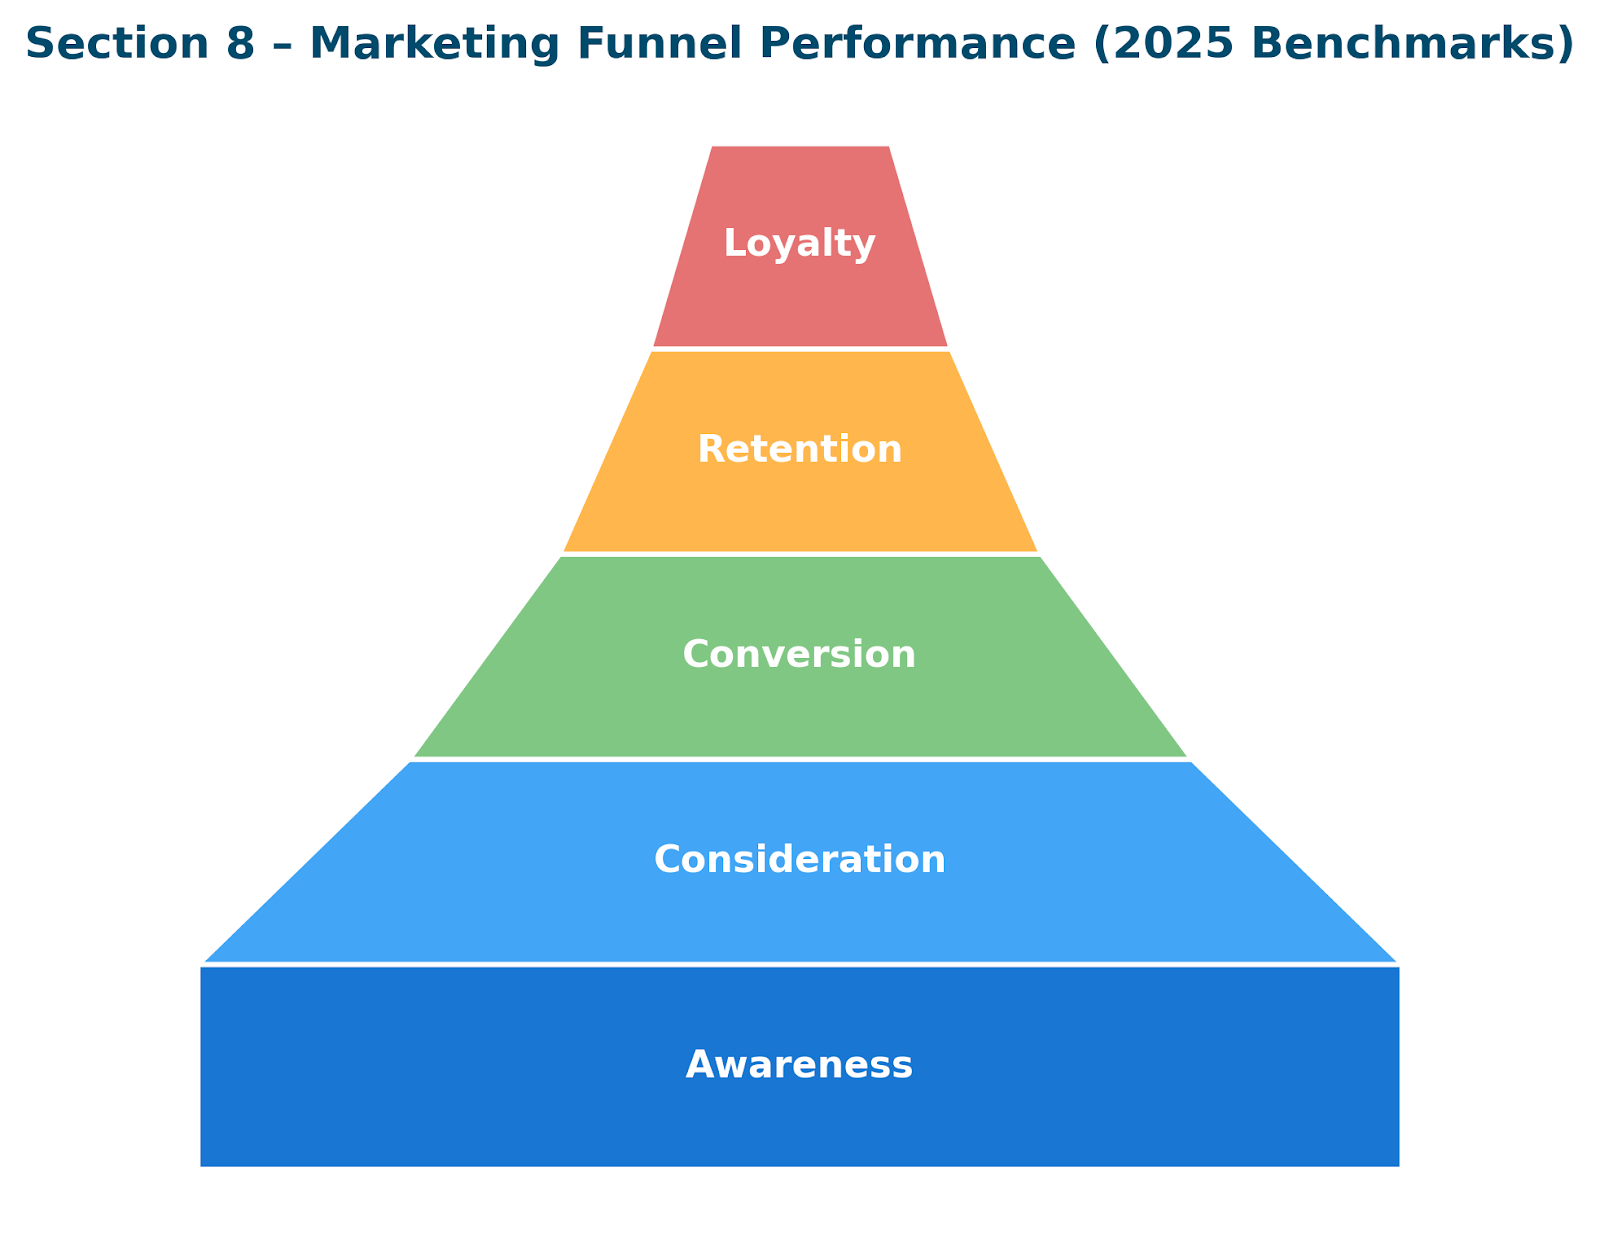
Awareness

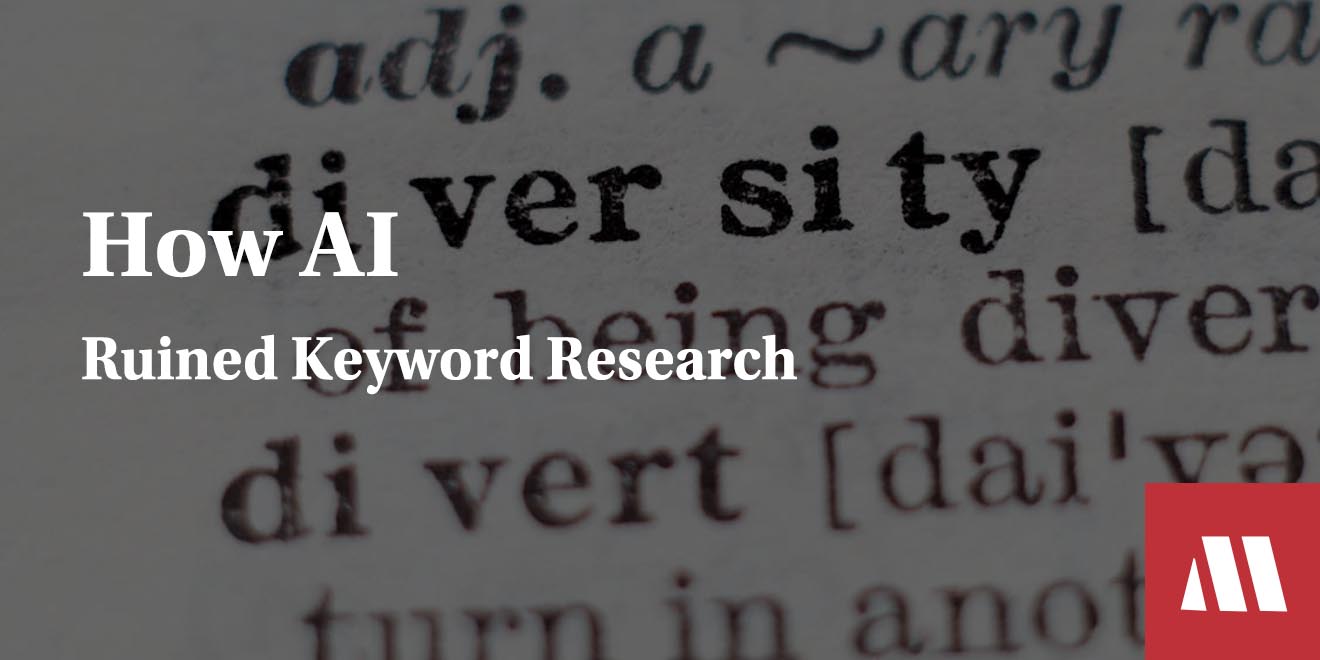

For more than two decades, keyword research sat at the center of digital marketing.
Keywords helped marketers understand how people searched, what they wanted, and where demand actually existed.
Done well, keyword research forced discipline. It required judgment. It demanded context.
Then AI arrived.
In theory, artificial intelligence was supposed to make keyword research better—faster analysis, deeper pattern recognition, fewer blind spots. In practice, it did something very different.
AI in digital marketing didn’t refine keyword research. It hollowed it out. What was once a strategic exercise became a mechanical one. What was once a signal became noise—just scaled, automated noise.
AI is here to stay, and in many areas of marketing it is genuinely transformative. But keyword research is a cautionary tale. It shows what happens when marketers confuse automation with insight, speed with accuracy, and confidence with truth.
AI didn’t save keyword research. It ruined it.
Before AI became embedded in every keyword tool, the keyword research process was slower—and better for it.
Marketers manually evaluated search results. They read the pages that ranked. They paid attention to search intent, language, and nuance.
A keyword wasn’t just a phrase with search volume attached; it was a hypothesis about demand. Ranking for a term meant understanding why people searched for it and whether that intent aligned with the business, target audience, or at least the ideal customer profile (ICP).
The data was imperfect.
Search volume data estimates were often wrong. Competition metrics and keyword difficulty were blunt.
But the process forced critical thinking.
You couldn’t outsource judgment to an AI powered model. You had to look at the SERP and ask basic but critical questions:
Keyword research was constrained by human time, and that constraint was healthy.
Keyword research gave digital marketers the chance to exercise their strategy muscle.
Fewer keyword phrases meant more scrutiny. Strategy emerged naturally because the process required interpretation.
When AI entered SEO tooling, it promised scale.
Instead of researching dozens of keyword phrases, marketers could generate thousands of keyword ideas. Instead of analyzing SERPs manually, models would summarize search intent. Instead of slow deliberation, instant answers. Keyword research became something you ran, not something you did.
The problem is that AI doesn’t discover keywords—it predicts them.
Large language models don’t crawl the web or observe demand and real search data and search traffic in real time.
They infer patterns based on existing text.
When asked for keyword ideas, they generate what sounds plausible, not what is necessarily searched, valuable, or real.
This distinction between assumed demand and actual keyword use matters.
AI powered keyword research tools produce keyword lists that look authoritative.
They are clean, well-structured, and confidently presented.
But confidence is not accuracy, nor is it creative.
In many cases, these lists are nothing more than linguistic extrapolations—educated guesses trained on content that was already SEO-shaped to begin with.
As a result, AI keyword research tools tend to converge.
Different platforms, different interfaces, same outputs.
The same clusters.
The same “related queries.”
The same safe, generic phrasing.
What looks like insight is often just consensus hallucination--a new-looking output from a past derivation.
The most damaging effect of AI on keyword research is not hallucination. It’s recursion.
AI tools are trained on web content.
That content was already influenced by SEO tools.
Now new SEO tools are trained on content influenced by AI. The system feeds itself.
This creates a closed loop where originality disappears. Keyword phrases become recycled abstractions. Content responds not to users, but to other content. SERPs grow increasingly self-referential.
In this environment, keyword research no longer reflects demand—it reflects what marketers have already decided demand should look like.
This is why so much SEO content feels interchangeable. It’s not that digital marketers lack talent. It’s that the inputs are polluted.
When everyone uses the same AI-generated keyword ideas, differentiation collapses upstream.
Garbage in, scaled out.
Search volume used to be a directional signal. Today, it’s often a misleading artifact.
AI-driven keyword expansion inflates perceived demand. Models generate variations, modifiers, and long-tail keywords that may never be searched at meaningful scale. Tools then assign estimated monthly search volume and surface endless keyword suggestions based on extrapolation, not observation.
At the same time, the search environment itself has changed.
Zero-click searches are now the norm. Featured snippets, knowledge panels, and AI-generated search results intercept intent before users ever reach a website. Many searches still happen, but fewer result in clicks. Volume remains, value disappears.
Even worse, search volume data is backward-looking. They reflect historical behavior in a search ecosystem that no longer exists. Yet, AI keyword research tools present these numbers with increasing confidence, as if precision has improved rather than eroded.
Marketers chase “low competition, high search volume” keywords that look perfect in a dashboard—and produce nothing in reality.
The disconnect between keywords and revenue has never been wider.
As AI entered content creation, keyword research shifted roles.
Instead of informing content strategy, it became a content-filling mechanism--founded on previously-devised work.
Keywords turned into blanks to be filled:
“Write a 2,000-word article targeting these primary and secondary keywords.”
The goal stopped being relevance or usefulness. The goal became coverage. Content was designed to satisfy tools, not users. Pages were optimized to look SEO-compliant rather than to answer real questions.
This is why rankings increasingly fail to convert. A page can technically “match” a keyword search while completely missing search intent. AI makes this worse by optimizing for linguistic similarity rather than problem resolution.
The result is SEO-shaped content that no one remembers, no one bookmarks, and no one trusts.
While marketers obsessed over keyword lists and keyword planner exports, search engines quietly moved on.
Google no longer treats queries as simple lexical matches. Modern search is entity-based, contextual, and probabilistic. Queries are interpreted, not just parsed. Answers are synthesized, not retrieved.
Tools like Google Keyword Planner, Google Search Console, and Google Analytics still provide useful data points, but they don’t reflect how discovery actually works now.
AI Overviews accelerate this shift. Users increasingly receive answers without needing to click. Discovery happens at the topic and entity level, not the keyword level.
Traditional keyword maps—built around exact phrases and variations—fail to reflect how search actually works now. They assume a one-to-one relationship between query and page that no longer exists.
AI didn’t break keyword research because search changed. It broke keyword research because it failed to adapt to that change.
Despite all this, SEO isn’t dead.
Keyword research isn’t useless.
But its role has fundamentally changed.
What still works looks nothing like modern AI keyword workflows.
It starts with real demand signals: sales calls, customer emails, support tickets, on-site searches; not just search data. These sources reveal how people actually talk about problems—not how AI thinks they might.
It prioritizes intent modeling over keyword targeting. Instead of mapping pages to phrases, marketers map content to decisions. What does a user need to believe, understand, or compare before converting?
It emphasizes topical authority, not coverage. A handful of deeply useful resources outperform dozens of keyword-stuffed pages.
Most importantly, it reintroduces judgment. Strategy returns to humans.
AI is not the enemy. Uncritical automation is.
Used correctly, AI powered keyword research tools can assist keyword research without replacing it. It can cluster related keyword data, group related keywords, summarize SERP patterns, and surface search trends worth investigating. It can speed up analysis that a human has already framed.
Used incorrectly, AI becomes the strategist—and that’s where things fall apart.
AI should not be trusted to estimate demand, classify intent, or prioritize business value. Those require context, incentives, and accountability. Models have none.
The rule is simple: AI can support thinking. It cannot replace it.
The future of SEO does not revolve around better keyword research tools. It revolves around better understanding of demand.
Keywords are symptoms. They reflect interest after it already exists. Demand intelligence looks upstream—at market shifts, emerging needs, and behavioral change.
This is where SEO converges with product, sales, and brand strategy. The teams that win will stop asking “What keywords should we target?” and start asking “What problems are becoming urgent, and how demand expresses itself across channels?” That’s where opportunity lives. Not in another keyword magic tool export.
In an AI-native discovery environment—search engines, chat interfaces, autonomous agents—being useful matters more than being optimized.
AI didn’t ruin keyword research on its own. Digital marketers did that when they outsourced thinking to other tools, accepted synthetic certainty, and optimized for dashboards instead of outcomes.
Keyword research was never meant to be fast. It was meant to be thoughtful.
AI can still play a role—but only if marketers reassert control. Fewer keywords. More judgment. Less automation theater. More strategy.
The future belongs to marketers who understand that intelligence is not generated—it’s applied.


Despite Shopify’s strong brand recognition and substantial organic footprint, several challenges persisted at the off-site SEO level.
Key issues included:
The challenge was not generating awareness—Shopify already had that—but reinforcing authority and relevance in the external ecosystems that influence search visibility.
The campaign focused on:
Digital.Marketing executed a strategic off-site SEO and editorial link placement campaign designed to complement Shopify’s existing organic strength.
While detailed metrics remain confidential, the campaign delivered:

AI has completely transformed how brands find and engage audiences with digital marketing.
Traditional methods are no match for the precision and power of automation and real-time optimization.
Unlike manual segmentation, which depends on static categories and limited data points, AI integrates machine learning, predictive analytics, and behavioral signals to create dynamic audience segments based on campaign performance.
This AI tech evolution greatly reduces wasted ad spend and increases relevance, making outreach more effective.
AI-powered audience segmentation moves the game away from placing people in broad demographic buckets and into nuanced groups defined by behavior and intent. Instead of defining segments manually, AI can be used to identify patterns across vast data sources, including CRM records, real-time customer interactions, and historical behavior in order to create higher value audience segments.
This shift is important because generalized demographics often fall short of reaching the right buyers. Two people with identical demographic profiles can respond differently to a marketing message based on personalities, habits, content consumption, and prior engagement with the brand. AI closes this gap by segmenting audiences based on what they do, not just who they are.
· Real-time behavioral profiling. As users click, view, search, and perform other actions, AI takes all this data and starts updating profiles in real time, rendering static lists obsolete. For example, an ecommerce brand can use AI to automatically move a user from the “general interest” segment into a “high purchase intent” segment after repeated product page visits or cart additions.
· Predictive intent signals. Machine learning models assess how likely a person is to convert, allowing marketers to prioritize the high-intent segments rather than staying stuck with generic audiences. This can mean identifying users who are more likely to buy within the next 48 hours based on behavior like time spent on pricing pages or engagement with product demos. Rather than targeting everyone equally, marketers can allocate their budgets toward the users who are most likely to convert.
· Multi-source data fusion. AI has the ability to integrate disparate data, whether it comes from social media, the internet, or CRM systems in order to build richer audience profiles. This is something traditional methods can’t match. For example, AI can connect social engagement data with past purchase history to find patterns that you can’t see from the analytics on a single platform. A brand might learn that users who engage with specific LinkedIn posts and later visit a particular blog article convert at a higher rate.
· Dynamic segment refresh. Rather than auditing audiences quarterly, AI will recalibrate segments automatically as new data comes in. When user behavior changes, the AI will update the segment assignment on the spot. This not only makes targeting better but it automatically prevents showing ads to people who have already converted.
Using AI for segmentation enhances relevance and increases campaign efficiency by allowing marketers to focus their resources on audiences that are more likely to convert.
Predictive analytics turns raw data into hyper-targeted audience groups. By identifying patterns and predicting behavior, AI can anticipate needs before users express them. This makes it possible to forecast purchase intent by analyzing signals like browsing time or repeat searches. AI can also identify users who are likely to churn or become repeat buyers. This makes it much easier to run highly targeted retention campaigns.
For example, businesses that sell subscription services can use predictive models to flag users who exhibit churn indicators like declining usage or reduced login frequency. The AI system can then trigger retention offers and personalized outreach to prevent cancellation.
But predictive analytics can also tell marketers when to target groups for the maximum impact. For instance, AI will identify the timeframes that get the most receptivity from a given segment, allowing marketers to send email marketing blasts at the optimal times. An ecommerce brand might find that specific segments engage late at night on mobile devices while others respond better on weekday mornings from desktop computers.
All of this information allows companies to allocate marketing budgets more effectively by focusing on segments with the highest ROI potential.
With machine learning, campaign parameters can be automatically updated to match audience behavior. These models refine themselves with each interaction, which increases the accuracy of targeting. Every click, scroll, conversion, or cart abandonment feed back into the model and helps it learn which actions correlate with success. Over time, assumptions are replaced with validated signals.
When user behavior shifts in the middle of a campaign, machine learning models will recalibrate segmentation without any manual input. For example, a user might initially look like a casual browser but then start comparing pricing and engage a demo. In this case, the system will move that user into a higher-intent segment and serve adjusted messages. No manual action required.
From there, the audiences that respond best to certain creatives or offers are automatically weighted higher. Some segments might click more on educational content while others prefer discounts or limited-time offers. The machine learning algorithm prioritizes the most effective message for each group. All of this gets synchronized across email, social media, search, and display ads so audiences are never siloed.
AI is an indispensable asset in programmatic marketing since ads are bought and served in real time based on audience insights. Different from traditional media buying, which relies on predefined placements and schedules, programmatic ad systems look at each impression and instantly decides if it’s worth bidding on based on predicted performance.
· Automated ad buy decisions. AI is fully capable of deciding where, when, and to whom ads are shown without human input. For example, when someone loads a web page or opens an app, AI will evaluate the individual’s profile, past behavior, device, and chances of converting all within milliseconds. If a certain threshold of probability is met, the system bids.
· Behavioral pattern targeting. Real engagement determines how audiences are classified and reached. This takes ads several steps past general demographics. Instead of targeting “men between the ages of 25-45,” AI will target users who have recently searched for competitor products, watched certain videos, or visited pricing pages a few times. These signals are more valuable and outperform general demographics in terms of conversions.
· Contextual vs. intent signals. AI increases relevance by assessing the context of where a user is and their intent. For instance, a user who reads a comparison article has a different intent than someone browsing social media, and AI will adjust bidding and creatives accordingly.
· Conversion forecasting for bidding. The automated system will bid more for impressions most likely to convert. If historical data shows a particular segment converts higher on certain platforms or at specific times, the bid will be increased for those impressions and other bids will be lowered.
Programmatic advertising powered by AI makes precision targeting possible and often achieves 2x-3x higher conversion rates compared to traditional demographic targeting.
Hyper-targeted marketing strategies go far beyond just targeting specific groups of people. It also supports tailoring messages for each audience segment. AI makes this shift possible by automating personalization logic that can’t be done manually at scale. Instead of creating a single message for every campaign, marketers have a pool of messaging for the AI system to choose from.
For example:
· Dynamic creative optimization. Ads will change in real-time based on a user’s interests and previous behavior. For instance, an online retailer can show one version of an ad that highlights free shipping to users who focus on price, while showing premium product features to users who have purchased high-end items.
· Contextual messaging. One user might see different creatives based on the time of day, the device they’re using, and where they came from. For example, a user browsing on their phone late at night might see short, urgency-driven messaging, but see longer informative content while on their desktop during the day.
· Journey-based touchpoints. Audiences are shown different messages that match where they are in the funnel. For instance, a first-time visitor might be given educational content to create awareness, while a returning visitor who abandoned their cart is given an incentive to make a purchase.
· Cross-platform personalization. All content is aligned to match a unified narrative, whether through email, paid ads, social media posts, or website content. When content is aligned across all platforms it prevents fragmented experiences like getting an introductory email for a second time after making a purchase from another platform. With cross-platform uniformity, the AI system synchronizes messaging so each additional touchpoint builds on the last interaction.
This level of personalization reduces wasted impressions and increases conversion rates to a degree not possible with manual segmentation and ad delivery.
While AI can profile audiences in a hyper-targeted manner, it can also alter the content that gets delivered. This makes AI more of a decision-maker than just a tool for audience selection.
An AI-powered system can select the content most likely to resonate with each audience segment and serve only that. For example, a SaaS company might learn that tech decision-makers respond more to product documentation than feature breakdowns, and non-tech stakeholders prefer case studies.
It can predict which subject lines, headlines, and calls to action will resonate most with each segment and adjust the language and imagery to match. Email campaigns can test dozens of subject line variations automatically and visual elements can also be swapped out for testing.
All of this performance data gets fed back into the creative strategy to be refined even more. Underperforming elements get identified quickly so they can be phased out, and high-performing elements are reused across campaigns. The result is a high message-to-audience match.
Accurate analytics is required to understand performance enough to start scaling marketing efforts aimed at the most effective segments. This is where AI truly shines. Traditional analytics can’t explain exactly why a campaign works. The more channels and touchpoints involved, the harder it gets. AI solves this issue by analyzing all data simultaneously to uncover patterns that can’t be detected manually.
AI can allocate credit across channels based on influence rather than the last click, test whether a campaign caused a conversion, and identify how much a certain segment contributes to the overall success of a campaign. For instance, while manual methods often incorrectly credit the final interaction for the sale, AI-powered attribution models can show when a paid ad brought in a new user, an email nurtured interest, or a search ad closed the conversion.
Once you identify the winning segments and marketing components, then you can scale more easily without worry.
Naturally, using AI for hyper-targeted marketing efforts raises privacy concerns. Hyper-targeting can feel invasive sometimes and it needs to be handled with care. Transparency, consent management, and data minimization are no longer optional.
However, AI systems are designed to respect user consent and minimize access to personal information. Exact user identities aren’t stored. AI targeting platforms typically rely on aggregated, anonymized, or pseudonymized data rather than raw personally identifiable information.
The key is to ensure AI models are being audited to ensure targeting doesn’t exclude or discriminate unfairly. This requires regularly testing models for bias, like whether certain demographic groups are unintentionally excluded from offers, pricing, or visibility. That’s why brands use internal AI governance reviews to evaluate data inputs and targeting logic to ensure ethical use and alignment with brand values.
On the back end, companies need to consult a data privacy attorney to ensure compliance with regulations like GDPR, CCPA, and other similar frameworks. Legal oversight ensures that hyper-targeting efforts are compliant.
What once required hours of manual work to segment audiences and rework those segments as data would come in, can now be executed in real-time with far more precision. By using predictive analytics, machine learning algorithms, programmatic advertising, and cross-channel personalization, brands can focus on the audiences most likely to convert while the system refines messaging on autopilot.
However, this technology doesn’t work on its own. Building hyper-targeted audiences requires strategic implementation and ongoing optimization. Without human oversight in these areas, even the most effective AI tools can fall short.
If you’re ready to level up from broad targeting and start building campaigns that automatically adapt and learn based on real-time data, working with a professional marketing team that understands AI is critical.
At Marketer.co, we specialize in building AI-powered audience strategies that combine predictive analytics, machine learning, and performance-driven creatives to help brands reach the right audience at the right time with the right message. Contact us today to learn how AI-powered audience targeting can help your business turn insights into measurable revenue growth while maximizing ROI and eliminating wasted ad spend.
The healthcare and medical-technology (MedTech) sector is undergoing a profound marketing transformation. Digital channels are no longer optional — they are central to how patients, clinicians and institutional buyers discover, evaluate and commit to care or equipment. For example, more than 72% of healthcare ad budgets are now allocated to digital channels. (Digital Silk, Promodo, WifiTalents) Meanwhile, the global digital-health market is projected to reach more than US $500 billion by 2025.(Gitnux, Column, Apurple)
In the MedTech domain, companies are shifting from heavy reliance on device features and regulatory approvals to more sophisticated marketing-ecosystems built around evidence, outcomes, and multichannel engagement. As one recent industry review states: “MedTech marketing will require… sophisticated, multi-channel approaches and deep industry expertise.” (Red Branch Media, disrupting.healthcare)
Several strategic shifts are notable:
These benchmarks provide actionable yardsticks for marketing effectiveness: budget allocation, channel ROI, conversion expectations, and acquisition cost ceilings.
Interpretation:
There are two relevant TAM figures to note: one is the digital health / healthcare technology market (very high growth), and the other is the more general healthcare/MedTech market (larger base but slower growth). For marketing strategy, the key takeaway is that the digital-health ecosystem is expanding rapidly, offering new channel/engagement opportunities, while the more mature MedTech markets will still require innovation in marketing to tap into growth.
Implication:
Implication:
Based on the data:
Assessment:
In summary, the healthcare/MedTech sector presents a mixed marketing-terrain:

Understanding the audience landscape is central to modern healthcare / MedTech marketing. In 2025, the line between “patient,” “clinician,” and “purchaser” continues to blur, but each audience still has distinct motivations, decision patterns, and data expectations.
These are health-seeking individuals looking for trustworthy information, affordability, and convenience.
They often begin their journey with search engines or social media, researching symptoms or treatment options before speaking to a provider.
Their biggest frustrations are information overload, inconsistent messaging, and unclear costs.
They respond best to transparent, empathetic storytelling and educational materials that make complex information digestible.
Decision drivers: reputation of the provider, cost transparency, ease of scheduling, and perceived quality of care.
Best channels: Google Search, YouTube, Facebook, and personalized email reminders.
Clinicians and specialists represent a technically informed but time-constrained audience.
They engage with content that adds clinical or operational value — such as peer case studies, journal-backed data, and new device evidence.
Their challenges include regulatory pressure, time scarcity, and integration barriers between technologies.
Marketing that wins their attention offers concise, data-driven insights, ideally endorsed by respected peers or medical associations.
Decision drivers: clinical proof, usability, and integration with existing workflows.
Best channels: LinkedIn, continuing-education webinars, trade journals, and professional newsletters.
These buyers are institutional decision-makers balancing budget efficiency, compliance, and reliability.
They oversee purchasing cycles for hospitals, group practices, or health systems, often evaluating multiple vendors simultaneously.
Their pain points revolve around ROI justification, interoperability, and vendor accountability.
They prioritize brands that provide measurable outcomes, lifecycle support, and compliance documentation.
Decision drivers: total cost of ownership, regulatory readiness, vendor track record, and post-sale support quality.
Best channels: LinkedIn, trade publications, RFP platforms, and in-person or virtual medical conferences.
This persona represents tech-savvy individuals using apps, wearables, and telehealth for wellness or preventive care.
They’re motivated by performance, personalization, and social validation.
Their main barriers are app fatigue, data privacy concerns, and interoperability gaps between platforms.
They respond to emotionally engaging, progress-oriented marketing that helps them visualize improvement over time.
Decision drivers: usability, data security, compatibility with other devices, and visible results.
Best channels: mobile app stores, influencer-led video reviews, podcasts, and community forums.
Insight:
Healthcare marketing can no longer rely on generic messaging. Segmentation by motivation and decision context enables personalised outreach: the “why” (health outcome) must match the “how” (digital journey).
Demographic Shifts
Psychographic Shifts
Implication:
Marketing messages must emphasize control, personalization, and trust. The patient/clinician relationship is being augmented by data transparency and experience design.
For patients and individual consumers, the path to care has become self-directed and multi-channel.
For clinicians, hospital administrators, and MedTech buyers, the path is more rational and evidence-driven.
Insight:
The clinician/buyer journey is longer and more data-driven, while the consumer journey is faster and emotionally influenced. Both require evidence and empathy, but via different tactics and channels.
Healthcare audiences in 2025 expect brands to treat their personal information with the same respect as their medical data. Privacy is now a purchase criterion, not an afterthought. A recent Harris Poll found that 81 % of patients want clear explanations of how their data is used before they share it. Organizations that communicate HIPAA and GDPR compliance transparently — with simple, reassuring language — gain trust and long-term retention.
At the same time, audiences demand personalization comparable to consumer tech experiences. They expect emails and ads that feel tailored to their conditions, preferences, and location. AI-driven segmentation and trigger-based journeys allow marketers to deliver this without sacrificing privacy. The goal is to make every interaction feel contextually relevant while remaining ethically compliant.
Finally, speed and responsiveness have become decisive. Nearly half of patients (48 %) say slow responses prevent them from booking appointments (Rock Health 2024). Real-time chat, instant appointment links, and AI assistants that triage inquiries bridge this gap. The faster a brand responds, the stronger the conversion and the greater the perceived trustworthiness.
Beyond functionality, patients and clinicians now want transparent, educational communication. They are wary of promotional claims and prefer evidence-based explanations supported by citations or expert endorsements. This shift toward factual storytelling is reshaping content strategy across the sector.
Strategic Takeaway:
The modern healthcare audience values clarity over complexity, personal relevance over generic messaging, and responsiveness over reach. Marketers who communicate with precision, compassion, and ethical transparency will set the standard for trust and growth in the 2025 MedTech era.

Here is a table showing typical channel performance in the healthcare/MedTech sector (CPC = cost per click, CVR = conversion rate, CAC = customer acquisition cost) along with comments. These are indicative benchmarks drawn from recent industry sources.
Implication: The technology stack for marketing in Healthcare/MedTech is rapidly growing — marketers must keep pace with tool adoption, integration, and data-platform maturity to compete effectively.
Gaining momentum
Under-leveraged or challenged
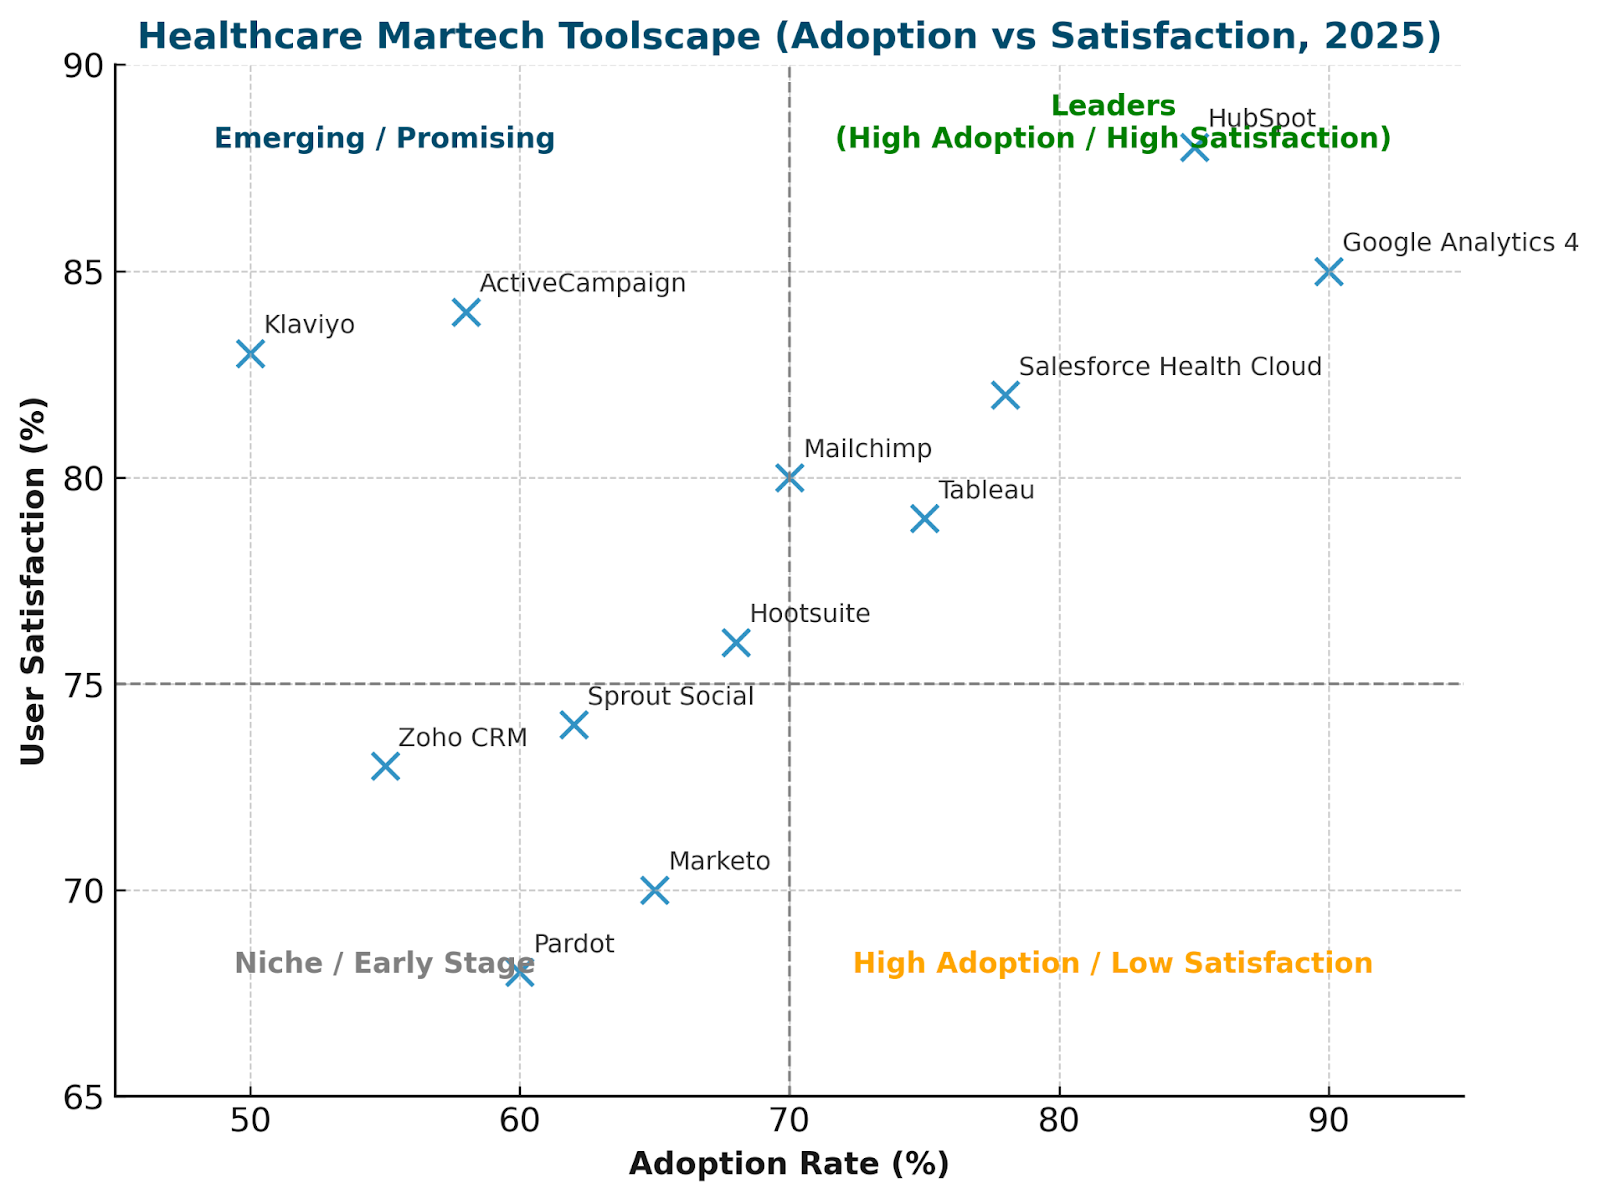
Suggested positioning for Healthcare/MedTech MarTech tools:
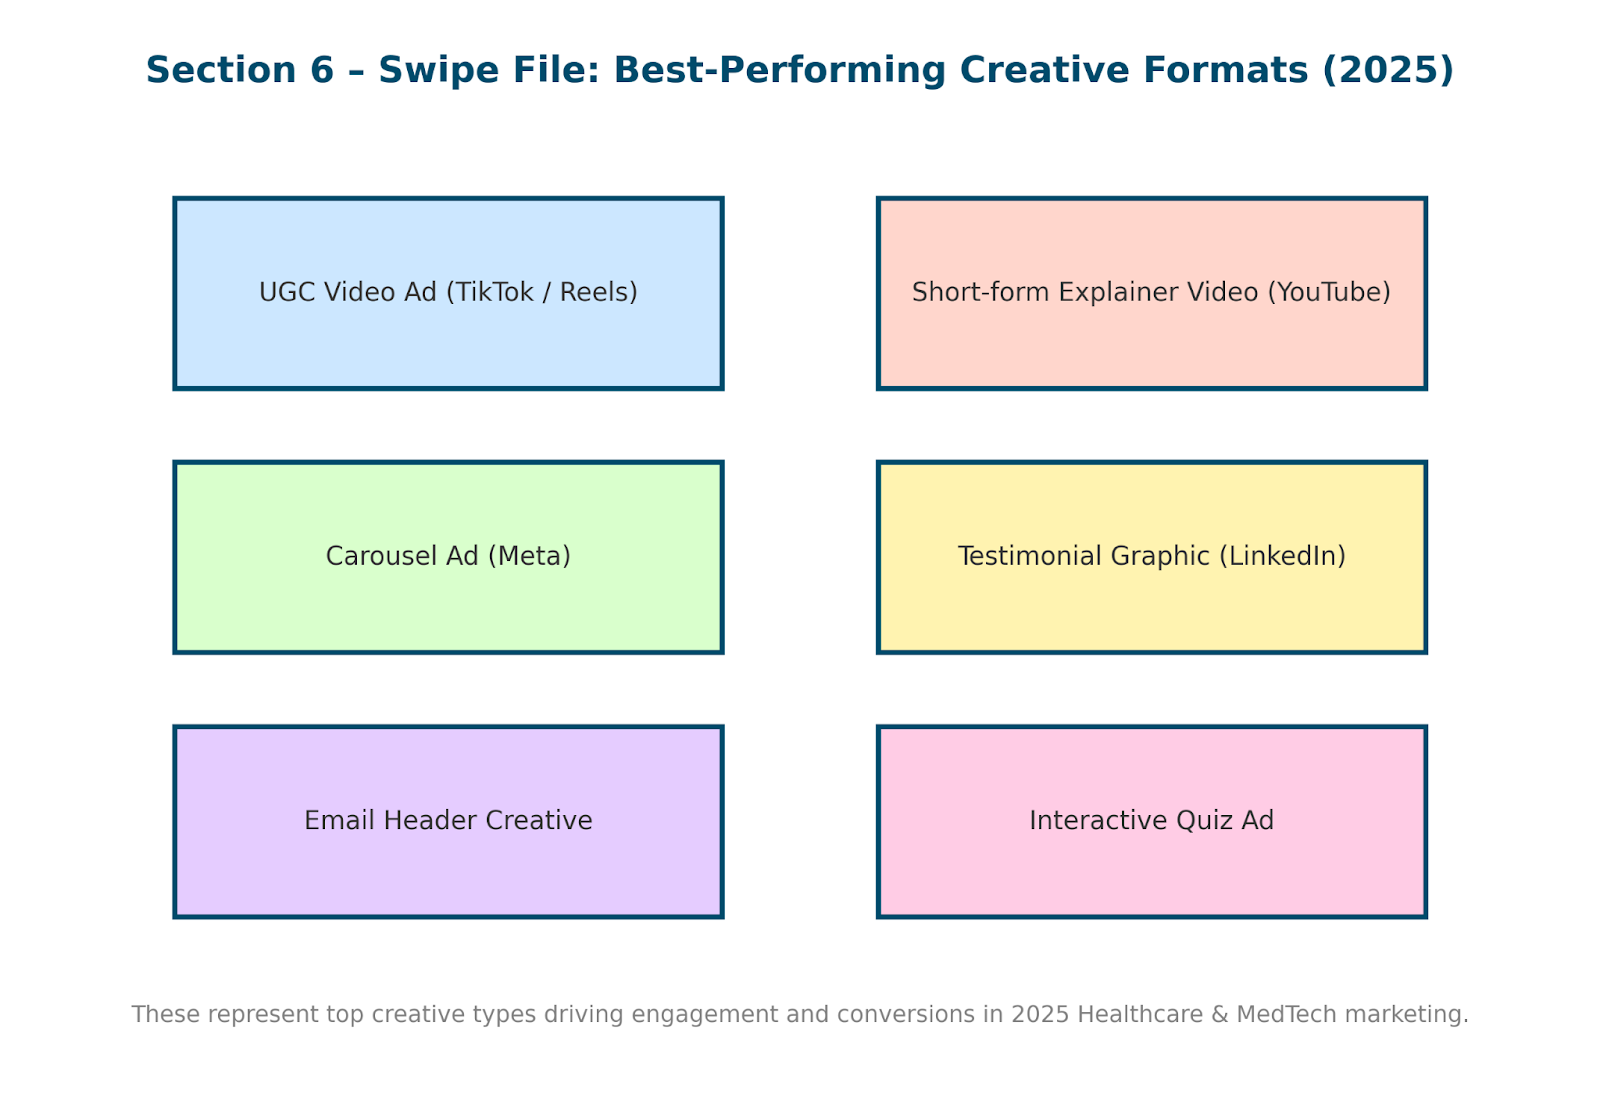
Healthcare and MedTech marketers are shifting from sterile, compliance-heavy creative toward human-centered storytelling and evidence-driven narratives. The winning formula blends credibility (facts, compliance) with empathy (human outcomes).
According to Hootsuite’s 2025 Healthcare Benchmarks, video and UGC (user-generated content) drive the highest engagement across platforms — 3.7 % on Instagram, 3.3 % on LinkedIn, and ~2 % on Facebook.
Short-form videos, carousels, and real-patient or clinician testimonials outperform static graphics by 60 – 90 % in CTR (Promodo 2024).
Instead of rigid templates, high-performing campaigns follow a clear emotional or informational logic:
Strategic takeaway: blend emotion + evidence. Every successful healthcare CTA contains either measurable outcomes or a personal story—never pure hype.
Creative performance has shifted decisively toward authentic, dynamic formats:
Strategic takeaway: adopt a “video-first, proof-driven” creative stack; prioritize authenticity over polish to satisfy both engagement and compliance.
Different healthcare segments respond to distinct emotional and informational triggers:
Strategic takeaway: map your creative tone to audience psychology—reassure providers, empower patients, inspire wellness users, and validate enterprise buyers.
The most effective healthcare / MedTech campaigns of 2024-2025 balance evidence, empathy, and digital precision.
Across paid, owned, and social channels, these campaigns shared three winning traits:
Objective: Increase awareness of cardiovascular-screening services and motivate early testing.
Mayo Clinic launched a short-form-video series across Instagram Reels, YouTube Shorts, and LinkedIn, sharing real patient stories of recovery after heart procedures. Each 30-second clip opened with a human moment, closed with a clear CTA to “Book a free heart screening,” and was reinforced through an automated email reminder sequence.
Results:
Why It Worked: Emotional storytelling rooted in clinical truth. The creative balanced empathy with proof, and retargeting converted awareness into real appointments.
Objective: Educate and convert hospital buyers on a new AI-assisted surgical platform.
Medtronic built a thought-leadership funnel around the theme “Smart Surgery in Action.” It combined paid LinkedIn ads, precision Google Search campaigns, and a webinar series featuring key-opinion-leader surgeons demonstrating real outcomes. Leads captured via LinkedIn Forms entered a nurture sequence that linked to case studies and ROI calculators hosted in Salesforce Pardot.
Results:
Why It Worked: Authority and education replaced sales language. Peer credibility plus seamless CRM integration turned awareness into pipeline velocity.
Objective: Drive new app installs and boost retention for its virtual-care platform.
TeleDoc produced 15-second TikTok and Meta Story videos dramatizing instant virtual-doctor access under the tagline “Care without waiting rooms.” A retargeting layer reminded uninstalled users within 24 hours, while re-engagement emails showcased real-time physician availability.
Results:
Why It Worked: Speed and convenience matched post-pandemic expectations. Authentic, mobile-first creative and user-generated testimonials lifted trust and engagement simultaneously.
Healthcare and MedTech marketers face a paradox in 2026: rapidly advancing digital tools are expanding what’s possible, yet privacy laws, cost pressures, and channel saturation make execution harder than ever.
Success depends on balancing innovation with compliance and automation with authenticity.
Across all digital platforms, costs continue to surge.
Meta and LinkedIn CPMs are up about 18% year-over-year, and healthcare search CPCs have climbed roughly 12%.
This is driven by stricter privacy-based audience restrictions, greater competition for verified data segments, and reduced retargeting visibility.
The effect is unmistakable: customer-acquisition costs (CAC) are trending upward even as click volumes stagnate.
To counter this, marketers must lean on conversion-rate optimisation, long-tail keyword strategies, and higher-value creative rather than sheer spend.
The compliance landscape is tightening.
Updated HIPAA guidance, new U.S. state privacy laws, and stronger GDPR enforcement are limiting how health data can be tracked, stored, and used for marketing.
Cookie deprecation and consent-banner enforcement have sharply reduced available audience signals.
The risk is two-fold: first, potential fines or reputational damage; second, a measurable decline in personalization capability.
The strategic fix lies in building first-party data systems, consent-driven CDPs, and transparent user-value exchanges that earn data willingly rather than extract it passively.
Organic visibility is shrinking fast.
Healthcare brands now reach under 4% of their social followers without paid support, as algorithms increasingly favor ad inventory.
Search results are dominated by ads, AI-summaries, and verified content hubs, crowding out smaller players.
The challenge is sustainability: brands cannot rely solely on paid amplification forever.
The opportunity is to invest in long-form educational content, community engagement, and SEO for AI-powered search (GEO: Generative Engine Optimization) to rebuild organic trust and discoverability.
Generative AI has entered nearly every marketing workflow—copywriting, design, and analytics—but accuracy and oversight lag behind.
While roughly 74 % of healthcare marketers report using AI tools, only about 37% have a formal review process for factual verification or regulatory compliance (HubSpot AI Report 2025).
In an industry built on trust, unverified claims or hallucinated data can be disastrous.
Organizations need AI-governance frameworks: clear editorial review, medical validation checkpoints, and audit trails that preserve both compliance and credibility.

The next phase of healthcare / MedTech marketing will reward precision, personalization, and regulatory discipline.
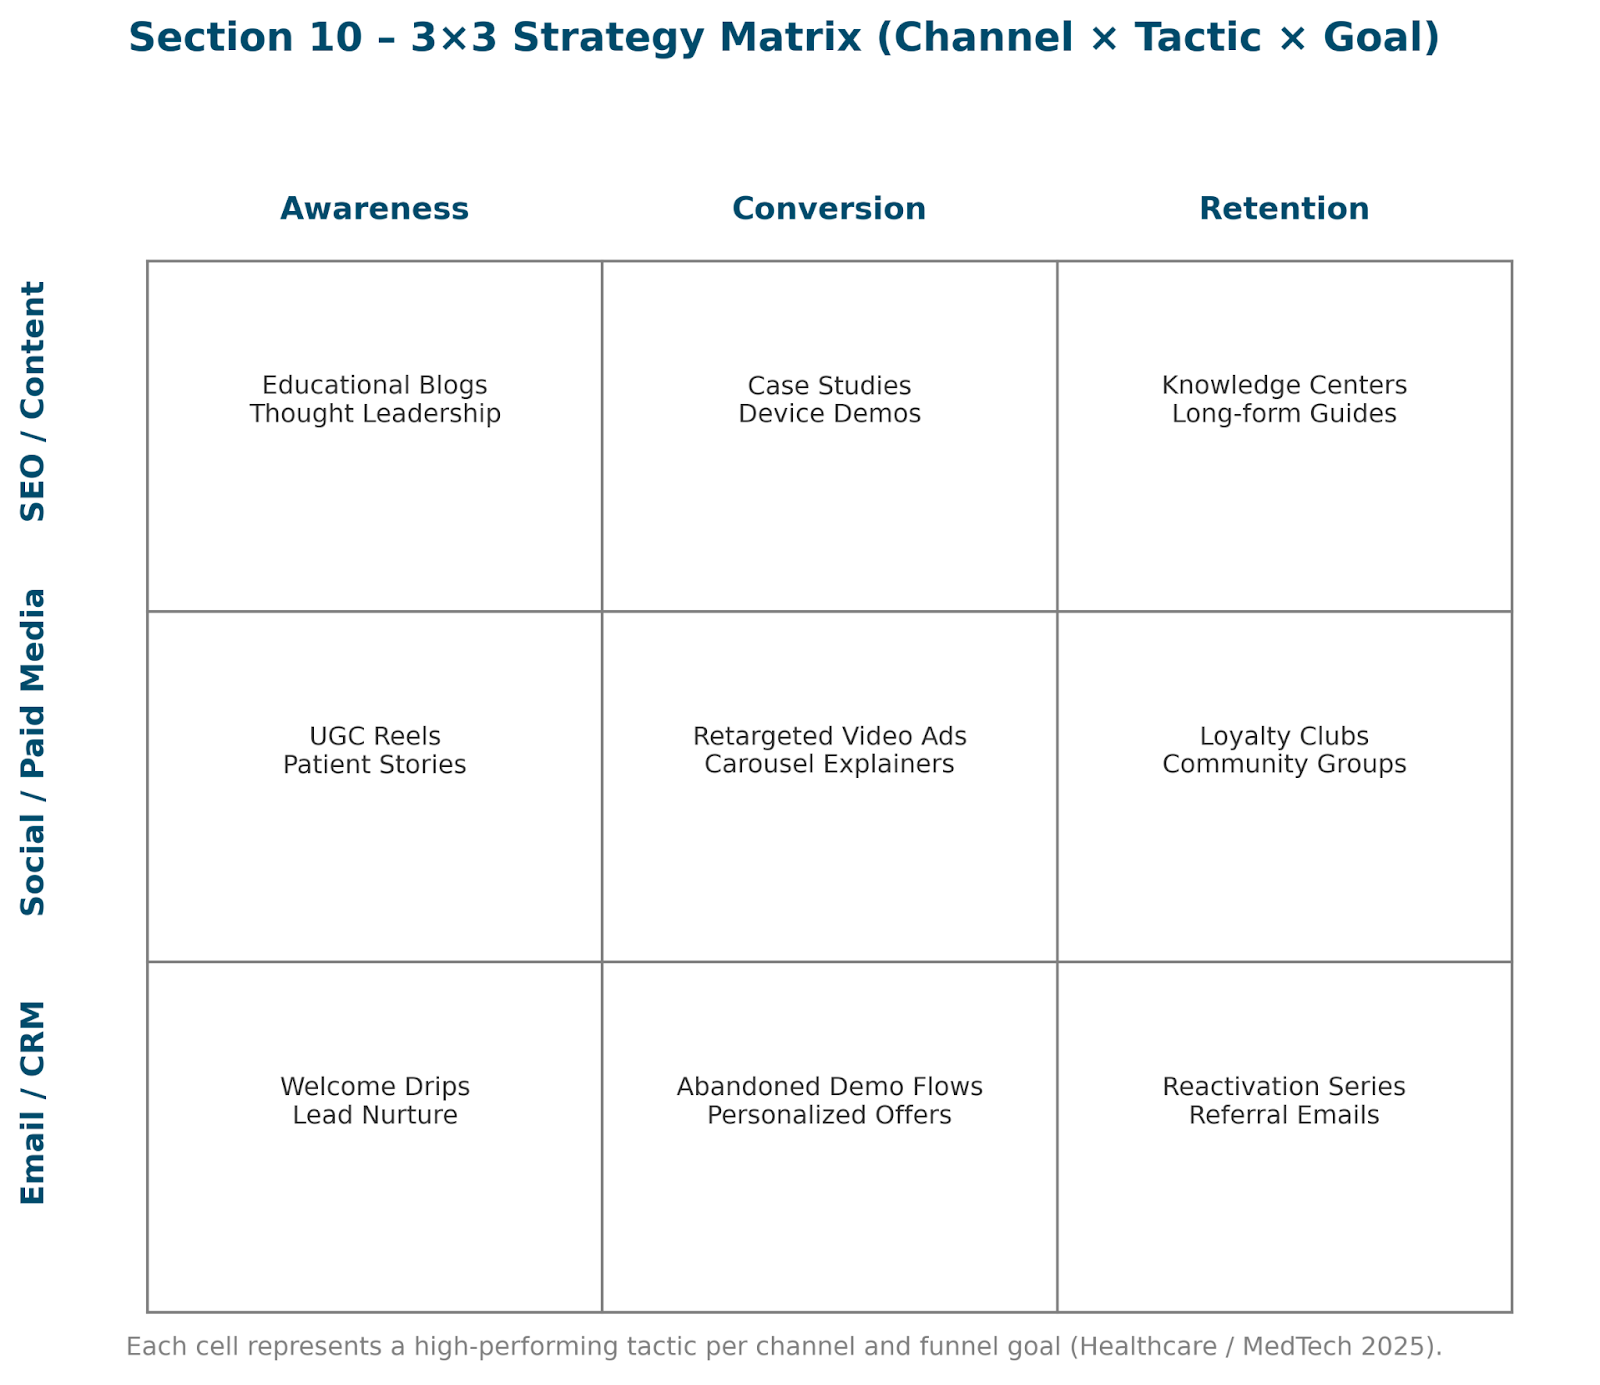
This section translates the trends and benchmarks from earlier sections into actionable strategy playbooks—tailored by organizational maturity: startup, growth, and scale.
Goal: build visibility and trust efficiently.
Core moves:
Goal: accelerate conversion & retention.
Core moves:
Goal: optimize LTV and brand authority.
Core moves:
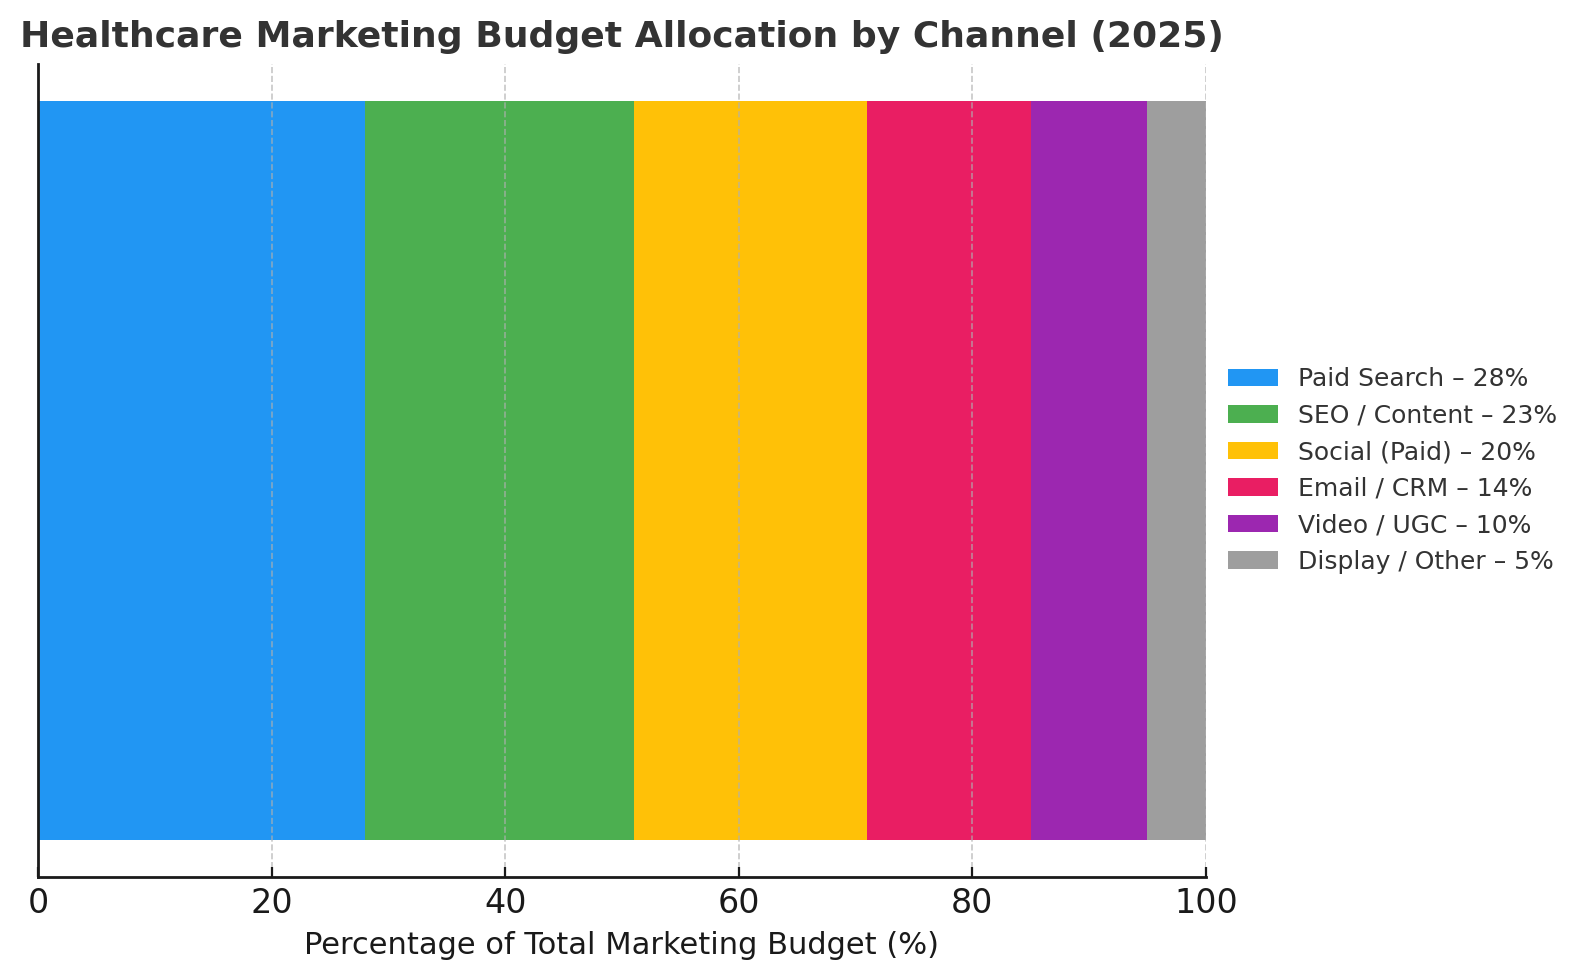
As healthcare and MedTech marketing budgets evolve in 2026, spending is becoming more deliberate and performance-oriented. The trend is clear: marketers are moving money away from broad, low-ROI awareness buys and into channels that provide measurable outcomes, first-party data, and long-term relationship value.
SEO and Content Marketing remain the highest-priority investments. With the industry’s average ROI approaching 5×, organic traffic and thought-leadership content deliver compounding returns over time. Brands that consistently publish medically reviewed articles, clinical explainer videos, and case studies see sustained inbound lead generation without rising media costs. Content built for AI-summarised search (“Generative Engine Optimisation”) will also gain visibility as Google and Bing integrate generative results more deeply.
Paid Search continues to be indispensable for intent-driven acquisition. Though CPCs have risen about 12% YoY, search remains the most efficient top-funnel engine because it captures existing need. Smart bidding, long-tail keywords, and geotargeting help offset cost inflation. Healthcare brands should maintain steady investment but continuously prune keywords for clinical accuracy and compliance.
Email and CRM Nurture Campaigns deserve higher budget share. They are the best retention channel in the sector, converting at roughly 4 – 5% and delivering CACs under $ 40. Personalized drip campaigns, behavioral triggers, and predictive segmentation extend lifetime value and improve patient or customer satisfaction. Many organizations are reallocating 10 – 15% of paid spend into CRM automations to improve retention economics.
Social Media Advertising—especially LinkedIn for B2B MedTech and Meta for consumer health—should hold a moderate budget position. CPMs and CPCs are climbing (+16 % YoY), but these channels remain vital for awareness, storytelling, and remarketing. Performance depends on fresh creative rotation and UGC-style authenticity rather than polished corporate visuals. Expect roughly 20 % of digital spend to stay here, primarily for brand building and retargeting.
Video and UGC Formats are now essential creative pillars. Short-form video (< 30s) achieves ~60% higher CTR than static ads, while clinician or patient-generated clips outperform branded content. Budgets should expand modestly in 2025 – 2026 to produce ongoing streams of authentic, compliant visual storytelling.
Events and Webinars continue to deliver value in B2B and clinical education contexts. Though not as scalable as digital ads, these experiences deepen trust and accelerate enterprise sales cycles. Marketers should integrate them with digital nurturing, using webinars as mid-funnel assets that feed email and retargeting pipelines.
Finally, Display and Traditional Media will continue their gradual decline in relevance. With CPMs high and click-through rates below 0.6%, these channels function primarily for awareness lift and frequency control. Combined allocation across display, print, and broadcast should stay below 10% of the total marketing budget unless brand equity building is a top strategic goal.
In summary:
Investment priority ranks as follows — SEO / Content (High), Paid Search (High), Email / CRM (High), Social and Video (Medium), Events (Medium), and Display / Traditional (Low). The guiding principle for 2025 – 2026 is to optimize for owned data and measurable ROI, not channel novelty.
1. Ad Budgets & Channel Mix
2. AI Adoption & Tooling
3. Platform Dominance & Shift
4. Regulatory & Data Landscape
5. Creative Evolution
“We’re seeing a phase-shift from reach to relevance in healthcare marketing. The winners will be those that treat data privacy as a design principle and not a constraint.”
— Maria Chen, CMO at MedTech Analytics, Health Marketing Review 2025
“Generative AI won’t replace creative teams—it will amplify them. In regulated sectors like MedTech, accuracy auditing will define brand credibility.”
— Dr. Alan Martens, AI Ethics Researcher, Stanford Digital Health Lab
The return-on-investment outlook across healthcare and MedTech marketing channels continues to shift as privacy regulation, automation, and creative innovation reshape cost efficiency.
The next two years will reward channels that combine first-party data, automation, and educational storytelling.
Email and CRM Automation will remain the single most profitable investment.
After years of consistent performance, email is forecast to deliver an ROI rising from 3.8× in 2024 to around 4.5× by 2026, as improved segmentation and AI-driven send-time optimization increase engagement.
Healthcare audiences still respond to personalized reminders, patient-journey emails, and outcomes-based follow-ups, making this the lowest-cost, highest-impact retention lever.
Paid Search should maintain strong efficiency despite rising costs.
ROI is projected to grow modestly—from 3.1× to roughly 3.6×—as automation improves targeting precision and reduces wasted impressions.
While CPC inflation (≈ +12 % YoY) pressures budgets, intent-based queries for specific treatments or devices remain unmatched for lead quality.
SEO and Content Marketing continue to dominate long-term value creation.
With compounding visibility and zero marginal cost per click, expected ROI climbs from 4.5× (2024) to above 5.3× by 2026.
Brands investing in medically reviewed blogs, clinician explainers, and AI-optimized site architecture will outperform peers as generative-search engines favor authoritative content.
Social Media (Paid), by contrast, will see gradual erosion in efficiency.
ROI is forecast to dip from 2.4× to ~2.1× through 2026 as CPMs rise and algorithms reduce organic reach.
Nevertheless, social remains indispensable for awareness, retargeting, and user-generated storytelling—particularly when paired with short-form video assets.
Video and UGC (Short-Form Content) are breakout performers.
ROI should increase sharply—from 3.7× to around 4.8× by 2026, making it the fastest-growing creative format.
Authentic, mobile-first content featuring patients or clinicians boosts engagement and trust while reducing production cost relative to traditional broadcast.
Finally, Events and Webinars are regaining traction in B2B MedTech marketing.
Projected ROI rises modestly—from 2.9× to 3.4×, driven by hybrid event formats and integrated post-event nurturing workflows.
These channels excel at deepening relationships with decision-makers and converting mid-funnel prospects into qualified leads.
In summary:
By 2027, the healthcare marketing ROI hierarchy will rank roughly as follows:
1️⃣ SEO / Content → ≈ 5× return;
2️⃣ Email / CRM → ≈ 4.5×;
3️⃣ Video / UGC → ≈ 4.8×;
4️⃣ Paid Search → ≈ 3.6×;
5️⃣ Events → ≈ 3.4×;
6️⃣ Social (Paid) → ≈ 2×.
The clear pattern is convergence on owned and trust-based channels delivering stable, privacy-safe growth, while high-cost paid social continues its slow decline in efficiency.


Data Collection & Analysis
This report combines quantitative data (industry benchmarks, ad-spend forecasts, engagement statistics) and qualitative analysis (expert commentary, case studies, and marketing-trend synthesis).
Analytical Approach
Industry Research & Reports
Creative & Campaign Performance Sources
CRM / MarTech Stack References

AI is the new duct tape (errr...slippery snake oil) of digital marketing—everyone’s slapping it on everything and hoping it holds.
Headlines scream about how ChatGPT will “replace marketers,” while pitch decks now feature “AI-powered” somewhere between “scalable” and “disruptive.”
It's beyond "bubble" and "hype" at this point.
But here’s the hard truth: If your strategy is broken, adding AI won’t fix it. It’ll just break faster and at scale.
AI can’t solve foundational strategy problems.
We'll show you with some real AI marketing faceplants, and explain how smart brands use AI as an amplifier—not a bandage.
TL;DR:AI is a tool, not a strategy. If your marketing plan is weak, AI won’t save you—it’ll just help you fail faster and louder--ultimately hurting your brand image more. Here we unpack why relying on generative AI tools without solid positioning, market segmentation, or clear campaign goals is a recipe for scale-without-sense.
Learn how to stop AI prompting in circles, siloes and echo-chambers and start building a digital marketing strategy worth automating and scaling.
There’s a temptation to believe that if you plug an LLM (large language model) into your marketing machine, all your problems will magically evaporate.
Take the now-infamous Willy Wonka Experience debacle.
The event was marketed with fantastical AI-generated visuals—think candy castles and golden chocolate rivers.
Reality?
A sad warehouse, confused kids, and a viral disaster.
When you market vapor with AI, don’t be surprised when the backlash is real.
Lesson: If your product is broken or non-existent, no amount of AI glitter will make it gold.
Think of AI as a megaphone.
It doesn’t change your voice; it just makes it louder.
So if you’re yelling nonsense, you’ll just annoy more people, faster.
Example: Coca-Cola’s AI Christmas Campaign.
The visuals were slick, but critics found the ads emotionally cold—like they were dipped in uncanny valley eggnog.
When a brand built on warmth and nostalgia replaces humans with AI-generated “joy,” the dissonance is deafening.
Using AI to scale outbound or content production before understanding your audience is like speeding toward a destination without checking the map.
A real-world case: A link building agency focused on B2B used AI to pump out hundreds pages—without ever validating product-market fit and assuming search engines wouldn't take notice.
Result? Crickets. No sign-ups, no replies, just a whole lot of burned budget and SEO clutter.
Snark aside: ChatGPT can’t tell you if your product sucks. Only customers can.
Then there’s the awkward case of Levi’s AI-generated models. Instead of hiring real models of diverse backgrounds, the brand used synthetic avatars.
The internet trolls were not impressed.
Critics accused them of sidestepping real representation in favor of digital optics.
Takeaway: When the goal is authenticity, generating fake people probably isn’t the best look.
Let’s not forget what AI learns from: data.
If your data is biased, incomplete, or just plain wrong, the outputs will mirror that.
Amazon’s AI recruiting tool famously penalized resumes that included “women’s” (e.g., “women’s chess club”) because historical data reflected gender bias. Amazon scrapped the system. Imagine unleashing that kind of bias on your PPC campaigns or creative strategy.
Yikes.
“We’ve added an AI co-pilot!” Great. For what? A pilot still needs a flight plan.
Many companies use AI as a buzzword placeholder for actual strategic thinking.
Google’s Gemini image generation fail is a case in point—offensive historical inaccuracies, hallucinated data, and a Super Bowl ad that had to be edited after the fact.
Reality check: AI needs constraints, context, and clarity.
Strategy is what gives it all three.
AI is powerful—but only in the hands of marketers who already know where they’re going.
Think of it like a Formula 1 engine: if your team doesn’t understand race strategy, track conditions, or when to pit, adding horsepower only guarantees a faster crash.
However, when paired with sound strategy, AI can be a force multiplier:
Start by mapping your customer journey and identifying what messaging belongs at each stage—from awareness to conversion to retention.
Then, use AI to atomize long-form content into smaller pieces: blog posts into tweets, podcasts into blog summaries, case studies into LinkedIn posts.
But don’t confuse motion for momentum.
Without knowing why the content exists and who it's for, you’re just making noise faster.
AI can deliver personalization at scale—but only if you’ve defined your audience segments, customer personas, and behavioral triggers.
If you skip the foundational segmentation work, your “personalized” messages will just be algorithmic guesswork.
They will also come across as extremely fake.
With the right audience understanding, though, AI can fine-tune tone, timing, and offers across channels.
AI excels at rapid iteration and optimization, but it needs boundaries.
Set clear KPIs like ROAS or CAC, and define your acceptable risk tolerance.
With a real digital marketing strategy in place, AI becomes a smart assistant for A/B testing creative, allocating budget dynamically, and improving performance with less manual tinkering.
AI can crunch data far better than most human analysts.
But if you haven’t defined which metrics matter (and which ones don’t), you’ll just end up with dashboards full of noise.
Strategy determines which questions to ask.
AI helps answer them faster—whether it's forecasting churn, identifying anomalies, or surfacing patterns in customer behavior.
AI can generate dozens of ad copy variants or landing page designs in seconds.
But velocity without intention leads to waste.
Build a testing roadmap.
Define hypotheses, testing windows, and evaluation criteria—then let AI do the heavy lifting within that strategic sandbox.
Guardrails make experimentation efficient instead of chaotic.
Here's an example of an internal testing roadmap for your next digital marketing campaign:
AI digital marketing is not a strategist.
It doesn’t know your goals, your brand, or your customer’s emotional drivers.
That’s your job.
What it can do is execute your strategy faster, scale your experiments, and surface insights you may have missed.
But the thinking—the decisions about where to go and why—still requires a human mind.
Preferably one that doesn’t outsource its job to an autocomplete model.
In other words: AI helps you move faster—but only if you’re pointed in the right direction.
If your business is adrift, AI will get you to the iceberg faster.
The marketing world doesn’t need more gimmicks—it needs better strategy.
The smartest brands in the AI age aren’t just asking “What can this tool do?” They’re asking:
“What do our customers actually need—and how can we use AI to deliver it better?”
And how can we do it with authenticity?
One of the biggest brand risks with using AI is tarnishing a reputation based on creating copy and creative that comes across as inauthentic. This is one of the biggest risks AI presents to your corporate brand.
But AI is admittedly getting better at strategy, which means marketers' jobs are still at risk of oblivion to the AI overlords.
Just because AI isn't as good at strategy now, doesn't mean it won't be able to beat you in the not-so-distant future.
Need help crafting a real strategy—one that AI can actually enhance?
Let’s talk. At MARKETER, we help brands build digital marketing plans worth automating at scale.

Global ecommerce and retail marketing is entering a performance-and-first-party era: online sales continue to set records even as overall ad-budget growth cools, forcing teams to squeeze more yield from every channel (Adobe, eMarketer). Discovery is shifting toward social platforms and retailer ecosystems, accelerating the rise of retail media networks with high-signal, closed-loop measurement and growing budget share (eMarketer).
At the same time, rising CPC/CPM and tightening privacy guardrails require consented data, durable measurement, and lifecycle programs that compound—email/SMS, loyalty, subscriptions—augmented by AI to speed creative testing, merchandising, and product discovery (WordStream, Privacy Sandbox, Litmus).
This report distills the latest benchmarks and channel dynamics—what’s working in search, retail media, social/video, and onsite conversion—and how leaders are containing CAC, raising LTV, and turning seasonal spikes into sustained growth over the next 12–24 months.
Global retail media ad investment (USD billions): $128.2B (2023) → $153.3B (2024) → $176.2B (2025). Source: WARC/Global Ad Trends. WARC+2WARC+2

Digital advertising ≈ 75% of total global ad spend in 2025; traditional ≈ 25%. Within digital, retail media’s share is rising fast (mid-teens of total ad spend globally). Sources: eMarketer (digital share) and WARC (retail media). EMARKETER WARC

Notes & how to read this section
Below are three high-signal ecommerce/retail buyer archetypes you can target and measure against, with attributes grounded in current behavior shifts.

Source notes:
This illustrates how paid media budgets skew across platforms in a large ecommerce cohort: Meta ~70.7%, Google ~23.1%, TikTok ~2.9%, Other ~3.3% (Pinterest, Snapchat, Reddit, etc.). Triple Whale

Method notes:
Where the momentum is: HubSpot continues to grow its installed base per 2025 earnings updates, while Salesforce remains the incumbent for large, global retailers that need deep customization. (Directional growth per HubSpot’s Q2-2025 results; Salesforce widely entrenched with very high review volume.) Skai G2
What’s changing: Marketing automation is the most-replaced martech category for the fifth year running, with integrations and features the top drivers for switching; cost is the top consideration for new purchases. Expect continued migrations from generic ESPs to commerce-centric platforms (Klaviyo, Braze, Iterable). MarTech+1 Chief Marketing Technologist
Stack direction: GA4 + BigQuery (warehouse) + reverse-ETL into the ad stack is becoming the default measurement spine; teams layer Mixpanel/Amplitude for journey insights where app usage or granular events matter. G2
Where share is moving: Shopify continues to expand share across e-commerce technologies; Adobe/Woo/BigCommerce hold in niches (custom, B2B, content-heavy) but face app-ecosystem pressure. BuiltWith
What’s trending: Budget flow into retail media keeps climbing, with teams consolidating onto cross-retailer platforms (Pacvue, Skai) for unified pacing/optimization and more consistent measurement. Pacvue Skai

Ratings & counts (sources):
Shopify 4.4/5, 4,706 reviews; integrations list includes Klaviyo, GA/BigQuery, Meta/TikTok, HubSpot, Salesforce. G2
Klaviyo 4.6/5. G2
Mailchimp 4.3/5. G2
Salesforce Sales Cloud 4.4/5. G2
HubSpot Sales Hub 4.4/5. G2
Google Analytics 4.5/5; native BigQuery export noted in integrations. G2
Sources (dated within last 12 months):
Torrid full-funnel TikTok case study and results (+31.8% apps, +7% purchases, +27% recall; 15/85 spend split; Unified Lift) published by TikTok for Business in 2024; Ovative case study (Mar 19, 2025) reinforcing incrementality (24× vs last-click). TikTok For Business Ovative Group
Matt Sleeps full-funnel Black Friday results (3× purchases, +128% traffic), Think with Google (Feb 2025). Google Business
HEYDUDE Amazon DSP + Buy with Prime outcomes (11.4× ROAS, 47% NTB, +13.3% AOV; +3.9% purchase-rate lift), Amazon Ads case study (2025) and Buy with Prime customer story (Mar 2025). Amazon Ads Buy with Prime
Key sources & corroboration:
How to read it:
Startup (pre-scale / <$5–10M GMV)
Growth (multi-channel / $10–50M GMV)
Scale (>$50M GMV / omnichannel)
Let's set the murder scene.
Content marketing had a good run.
It climbed from scrappy blog posts to multi-channel dominance, propped up by armies of freelancers and SEO strategists.
Then AI showed up like a Hitchcock villain with a smile and a knife.
Suddenly, the rules changed.
Content didn’t just get disrupted—it got dumped in the river wearing cement shoes.
Here’s the body count.

Remember when $100 blog posts were considered bargain-bin content?
Those were the glory days.
Now AI will crank out 1,000 words in less time than it takes you to make a bad cup of office coffee.
The result?
Entry-level and mid-tier freelance writers are being pushed out of the market faster than you can say “per-word rate.”
It's only one of the reasons we continue to see former inexpensive writers reaching out through our various sites peddling their content writing services.
Unfortunately, the glory days of remote-writer positions is dead.
On the technical side, large language models (ChatGPT, Claude, Gemini, LLaMA, take your pick) can spit out entire content calendars overnight.
For businesses, that means cheap, instant, infinitely scalable copy.
For human writers, it means the floor just dropped out.
Only market research specialists, storytellers, or industry insiders with unique insights are surviving this purge.
The content mills that used to churn out 500-word keyword soup just met a chef that never sleeps.
And guess what? AI is infinitely faster, cheaper (errr...free), and just as bland.
AI can mass-produce “10 Best CRM Tools” or “Top 7 Ways to Lose Weight with Intermittent Fasting” at industrial scale.
The affiliate sites (a.k.a. content farms) that once thrived on churning out formulaic fluff now face stiff competition from a machine that doesn’t demand benefits or bathroom breaks.
Add insult to injury: Google’s Helpful Content Updates and AI-detection algorithms are sniffing out generic sludge faster than ever.
The strategy of “more is more” died with AI’s arrival.
Now it’s about authority, originality, and actual experience.
AI didn’t just kill your content strategy—it stole your keyword list and set it on fire.
Long-tail keywords used to be a clever way for scrappy businesses to outrank the giants.
But AI models are trained on long-tail queries.
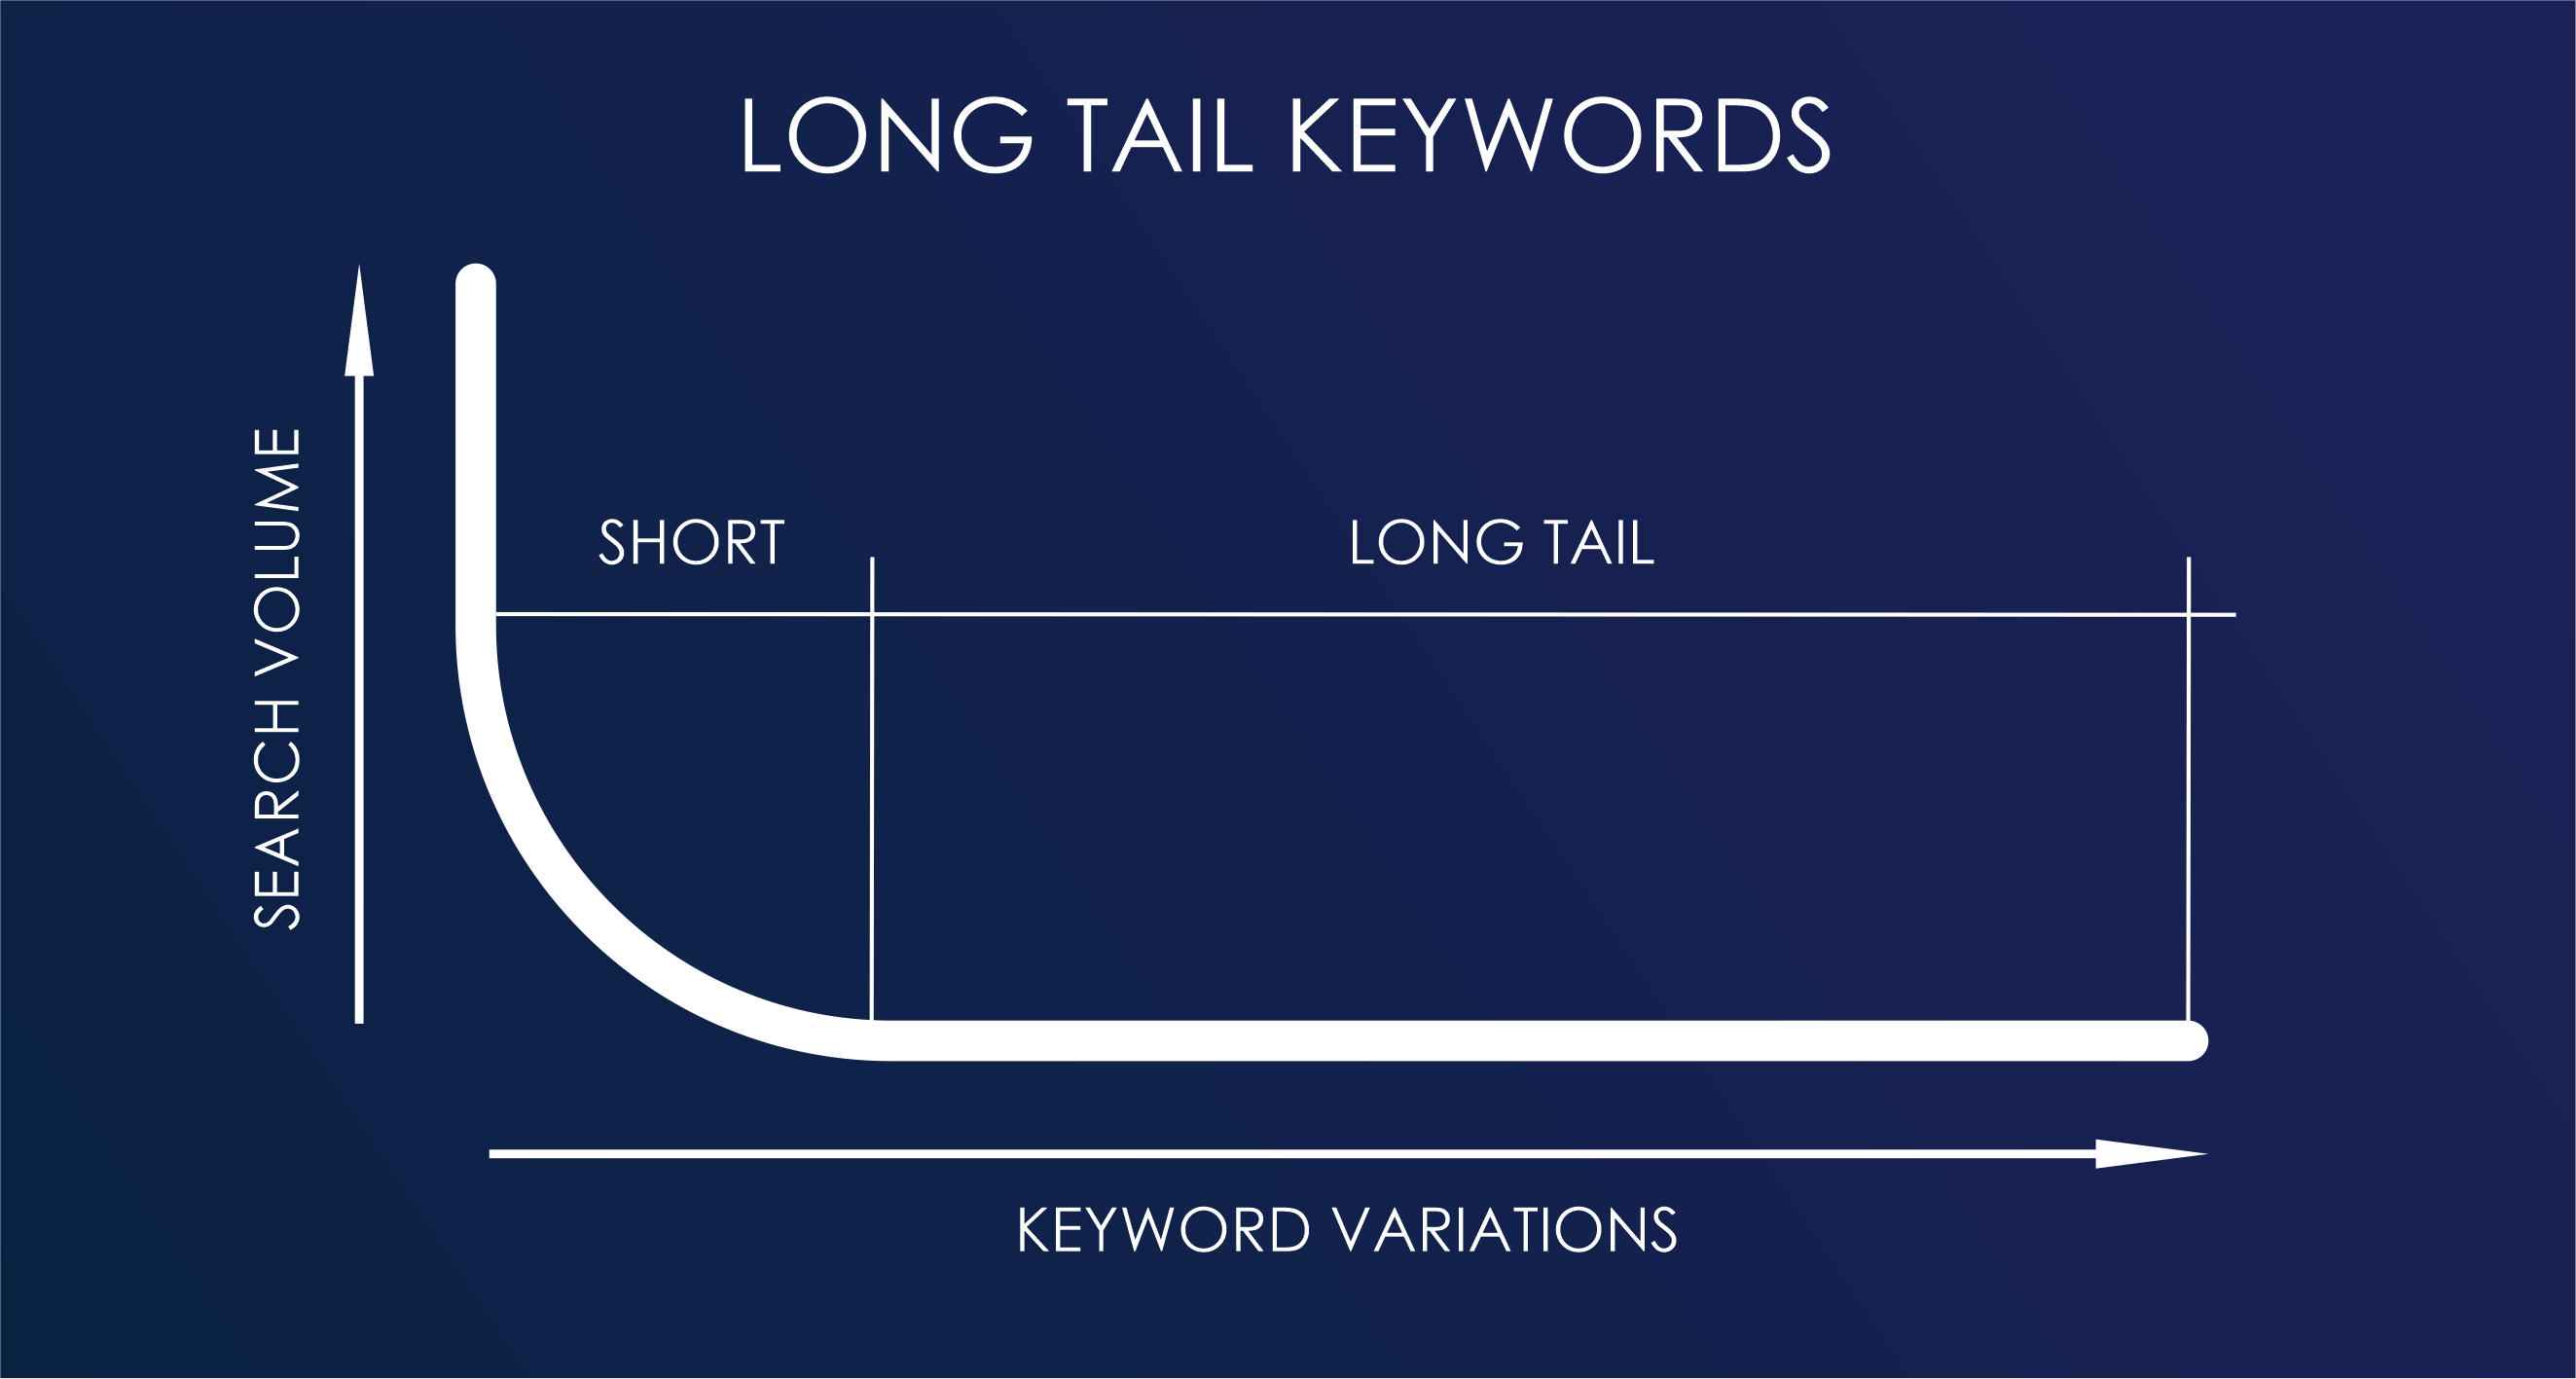
They know the obscure, weird, conversational phrases people search and how to answer them in an expanded way.
And instead of sending traffic to your carefully optimized blog post, AI often just answers the query directly.
Zero-click search is the new sheriff in town.
That means you can’t rely on ranking for “best ergonomic mouse under $30 in 2025.” AI already has an answer—and it’s not citing you.
When everyone uses the same AI, everyone sounds… exactly the same.
How many times have you read a blog post that starts with, “In today’s fast-paced digital world…”? That’s AI homogenization in action. It flattens tone, style, and originality into one beige voice.
For brands, that’s a death sentence.
Voice and differentiation used to be competitive advantages.
Now they’re diluted unless someone with a pulse (and an opinion) steps in to edit.
Real differentiation today comes from proprietary insights, creative storytelling, or just having the guts to be bold.
Why pay for steak when you can get free spam?
The explosion of free, AI-generated content has gutted the perceived value of content itself.
White papers, blog posts, and even eBooks feel cheaper because the supply has ballooned to infinity.
When everyone can produce an instant article, no one wants to pay for one.
The economics are brutal: supply floods, demand sags, prices collapse.
What is the only content with real market value now?
Things AI can’t easily fake—original research, expert interviews, proprietary data, or high-production multimedia.
Everything else is in a proverbial race to the bottom.
Okay, so the crime scene looks bad.
But not all content is toe-tagged.
Some is still alive and kicking—if you know where to look.
Content isn’t dead. But if you’re publishing beige AI sludge, it’s already in the morgue.
Let’s tally it up:
AI didn’t just disrupt digital marketing content—it left the chalk outline for everyone to see.
The survivors?
They’re the ones who stopped treating AI like a ghostwriter and started treating it like an amplifier.
Because in the end, AI didn’t kill all content.
It just killed the lazy stuff.
Ready to scale your digital marketing with AI?
Get in touch with us today to start the conversation.

Google’s AI Overviews have completely changed the way search engines bring websites relevant traffic. Before overviews existed, users had to click through search results and read page content to find the information they were looking for. In the process, business owners were able to generate sales, leads, web traffic, and brand awareness from those clicks. Some searches ended without clicks, but it wasn’t as common. Now we’re in a zero click world.
Users still perform more searches than ever, but fewer of them result in clicks. According to a SparkToro study, since 2024, 58.5% of U.S.-based Google searches have ended without users clicking any links. On mobile devices where convenience is critical, 75% of searches end without clicks. And it’s not because users aren’t finding what they need, but because the AI search engines and AI-generated overviews are answering their questions at the top of the page, without having to visit external websites. AI overviews aren’t always accurate. In fact, sometimes AI-generated responses can be outrageously inaccurate. Still, users seem satisfied with the information they’re being given.
Because of AI Overviews, many business owners are starting to notice a drop in organic traffic, especially in retail, travel, and media. This massive shift requires business owners to reinvent how they approach digital marketing strategies designed to generate visibility, authority, and conversions online.
A zero-click search is exactly what it sounds like: a search that results in zero clicks. The user types a query into the search box, hits enter, and then for whatever reason, they don’t click on any links. In the past, zero-click searches were usually the result of users refining their search or giving up. Today, it’s the opposite – users are finding what they need in the AI overview box and don’t feel it’s necessary to click on any search results to explore further. It’s because zero click search features like featured snippets, snippets knowledge panels, and AI-generated responses are doing the job upfront. In today’s zero click search world, users get fast answers without leaving the results page. This shift in search behavior is redefining how traditional search engines work.
Google’s AI Overview feature has been around since May 2024, and it’s just one of many features that continue to reduce traffic from organic search results. Between Featured Snippets, Snippets Knowledge Panels, Voice Search, People Also Ask boxes, and AI Overviews, clicks have been down by nearly half compared to what they were before 2022. AI search has taken things further by combining information from multiple external websites into a single response. Even news outlets are experiencing fewer clicks since Google is summarizing news articles as well.
This shift has real consequences for business owners. Even if your website ranks well in search engine results, users may never click through, which means fewer site visits. Your content might get featured in an AI Overview or Featured Snippet, but that still doesn’t guarantee clicks. That’s the reality of the zero click future.
In May 2024, Google launched its Search Generative Experience (SGE) to provide users with a summary of their search query. SGE uses content from numerous web pages to provide users with a quick overview that summarizes key information so the user doesn’t need to click on a dozen links and read a bunch of content. These AI engines prioritize clarity, accuracy, and authority. They rely less on traditional keyword signals and more on context, trust, and relevance.
· How Google selects sources. Around 52% of the pages used to create AI Overview summaries are typically ranked in the top 10 for the given query. According to Ahrefs research, 99% of Featured Snippets come from pages that already rank on the first page. This makes ranking in the top 10 critical for getting clicks from Google’s AI-generated results.
· The adoption of AI Overviews. Currently, AI Overviews show up in 30-35% of U.S.-based Google searches, with an even bigger presence for queries related to problem-solving.
· How click-through rates are impacted. Even though Google includes clickable citations in AI Overviews, many website owners are noticing a decline in website traffic. Despite clickable citations, a large percentage of users are satisfied with the overview.
While many sources still come from top-ranking pages in search engine results, being ranked number one doesn’t guarantee website traffic anymore.
Users see the answer and move on.
That’s a major shift from how traditional search algorithms used to work.
Now that zero-click searches are dominant, Google’s AI summaries are changing the fundamentals of SEO.
· Traffic. Although clicks were never guaranteed, ranking in the top positions in the search engine results pages (SERPs) used to be an excellent way to get website traffic to your website. Today, ranking number one no longer means getting the lion’s share of clicks and site visits.
Higher rankings are still better than being buried on page 10, but even web pages that rank in position one are seeing a significant loss of clicks. In fact, MailOnline reportedly loses over half its clicks when an AI Overview appears in Google’s search results. If users are satisfied with the AI-generated summary, they won’t even scroll down to the actual search results, let alone click on any links.
However, if you rank in the top positions, Google might use your content to write an AI Overview or Featured Snippet, but that doesn’t guarantee clicks, either. Users won’t necessarily click through to your website’s citation after reading the AI summary.
· Visibility. AI overviews take up even more space at the top of the page, forcing organic search results down even further out of view. Between featured snippets, snippets knowledge panels, and AI summaries, search engines are prioritizing answers over links.
· Keyword density. Keyword stuffing has been dead for a long time, but even just using relevant keywords and phrases has been weakened by AI engines. Keywords alone can’t compete with the power of citations and trust determined by a well-trained AI algorithm.
· Metadata is different. Since the name of the game has now shifted to getting your content cited in AI Overviews, metadata is important in a different way. For instance, Schema markup helps AI search engines understand your content better for use in overviews and improve your chances of appearing in zero click search features.
· EEAT is essential. Google’s EEAT framework (Expertise, Experience, Authoritativeness, Trustworthiness) has always been important for ranking, but now it determines what content gets cited in AI Overviews.
In short, SEO has evolved from simply maximizing keywords and phrases to building trustworthy, authoritative content. This shift has been happening for many years, but with AI engines running the show, it’s much harder to trick the system into thinking content is genuinely authoritative.
Google’s AI-generated summaries don’t seem to be going away anytime soon, so it’s critical to have a content strategy that works with this new zero click search world to avoid being left in the SEO dust. In addition to ranking, your content needs to be visible to AI search engines, worthy of being cited, and enticing enough for users to click. Here’s how that’s done:
· Lead with concise and accurate answers. To get AI algorithms to pick your content for summaries and overviews, you need web pages with clear, concise answers at the top of the page, followed by a deeper context. This is the structure that AI will understand best when choosing citations. Short, direct explanations increase your chances of being featured in featured snippets or ai generated responses.
· Use structured data. Schema markup is essential for getting content chosen for AI summaries. Use formats like “FAQ” and “HowTo.” Websites that correctly apply FAQ schema see a significant increase in traffic.
· Get specific and detailed. The more specific your content is at addressing topics, the better. AI tends to favor case studies, examples with dates, and quotes from experts. This signals high value, trustworthy content.
· Position yourself as an authority. Demonstrate EEAT through your credentials, citing your sources within your content, and publishing author bios. Detailed examples, stats, and expert insights improve your authority across external websites. AI algorithms view this information as trustworthy.
· Optimize your content for direct answers. Content optimized for direct answers (answer engine optimization or AEO) will get better visibility. For instance, create FAQ sections, paragraphs with definitions, and short summaries inside longer pieces of content. Strong presence across marketing channels and other marketing channels builds trust signals that AI systems recognize.
When clicks from search results drop, you need a different strategy for measuring performance and results. Here are five ways to overhaul your tracking system to fit in with the new AI-powered paradigm.
Clicks to your website might be the ultimate goal, but now that there are barriers in place, AI citations are the new goal. Start tracking where your content shows up in AI citations using Semrush or SurferSEO, AI search results, featured snippets, and other zero click search features.
A lower CTR used to indicate that users aren’t seeing your content. However, a lower CTR today might be offset by higher visibility in AI overviews. In other words, they see your content, but just don’t click.
In Google Search Console, filter queries that are triggering AI Overviews. Compare the impressions to clicks before and after this feature rolled out.
Branded searches still generate clicks, drive traffic, and should be optimized for conversions and site visits.
AI Overviews are generated from authority mentions and quotes. Use social and brand monitoring tools across marketing channels to manage your reputation and improve the way AI Overviews mentions your brand and reduce reliance on traditional search engines.
When you’re getting fewer clicks because of Google’s AI Overviews, your offsite link building strategy needs more power. In addition to a strategy for ranking, you need a plan that includes the following:
· Authority building through brand mentions. You need citations from trusted sources, like blogs, publications, and expert roundups to get AI to rank your content for inclusion in AI summaries. You’re building authority across external websites so AI engines trust your content.
· Authority positioning. It helps to be well-represented in terms of your brand across authoritative sources, like Wikipedia entries, about pages on your website, and various profiles across the web and marketing channels.
· Diversified traffic sources. Zero-click search highlights the importance of not relying entirely on Google for your traffic. It’s wise to invest your time generating traffic from email marketing, social media, partnerships, and customer/client referrals. Diversifying traffic sources also protects you from losing website traffic in the zero click future.
· Generate high-quality citations. When you can earn quotes and data references in respected publications, it will signal depth and trust to the algorithm that creates AI Overviews.
The tools and strategies in a zero-search world are still evolving, but for now, start using these basics:
· Platforms for AI optimization. Tools like Semrush, Ahrefs, SurferSEO, and MarketMuse offer AI Overview analysis and snippet alignment. For example, Semrush’s Position Tracking tool will tell you what keywords trigger AI Overviews and whether or not your site was included in the citations.
· Generative Engine Optimization (GEO). Leverage AI-specific metadata. For example, many website owners are starting to use the llms.txt file to help large language models understand and process their website more easily. This is a simple markdown file that provides a structured overview of a website’s content specifically tailored to LLMs. For example, the file includes summaries, important links, and contextual information to help LLMs avoid HTML and use the content to answer questions more easily.
While there’s still a debate regarding whether or not this actually makes a difference, it doesn’t hurt to experiment. Considering how crucial sitemaps are for search engines, it makes sense that llms.txt could become equally essential in the near future.
· Use ChatGPT to refine content. Start prompting ChatGPT to simulate AI Overviews and test if your content is used.
· Regular content audits. As always, continue performing regular content audits, improve FAQ sections, revamp content, and update data to ensure your content stays fresh for AI. Keeping your content fresh improves your chances of appearing in AI-generated responses and featured snippets.
All the traffic lost to AI Overviews may not be as bad as you think. Losing traffic isn’t inherently a problem if that traffic doesn’t convert anyway. If you’ve lost website traffic since AI Overviews were introduced, but your leads and sales haven’t dropped, you probably don’t need to worry too much.
When users are satisfied with an AI Overview, they’re probably not looking to buy and are still at the top of the funnel gathering information about a given topic. Many zero click search queries come from users who are still researching. They aren’t ready to convert. While it’s important to capture leads at all stages of the customer journey, users who simply gather information from an AI Overview and bounce are not going to buy from you right away. This means the queries that end in zero clicks aren’t going to be your most immediately profitable search terms.
Start creating and ranking content for AI queries that indicate a user is ready to buy. Users who are ready to buy and are actively looking for products and services will continue scrolling to the organic search results. That’s how you win in a zero click search world.
We have officially entered a new world where zero-click searches and AI-generated summaries are the standard. While traditional rankings are still important, they no longer guarantee visibility or traffic. In 2025, SEO means optimizing your content to be seen and cited by AI engines, not just to get clicks. Business owners who can align their content with answer engines through structured, authoritative, conversational content will dominate the new search world. The future belongs to brands that understand search behavior, build authority across external websites, and adapt to the zero click future. Those who don’t will quietly vanish as AI answers take over the top real estate in the SERPs.
If you’re watching your search traffic drop, wondering how to stay relevant now that AI Overviews have changed the game, you don’t have to figure it out on your own. Our team of digital marketing experts can help you adapt to the future by optimizing your content for visibility, authority, and conversion through SEO as well as professional digital marketing strategies. Contact us now for a free consultation and let’s turn AI-powered search into your competitive advantage.

.svg)


.png)

